Getting Started
2. Create a New Case
The Dashboard is the landing page where all patient cases are displayed. From here, you can create a new case or access an existing one.
- Open the Reporting Portal.
- If no cases exist, the page displays a Create Case button.
- Once the Create New Case option is selected, they will be asked to add in Patient Information. The patient Information, if missed can be edited later as well.
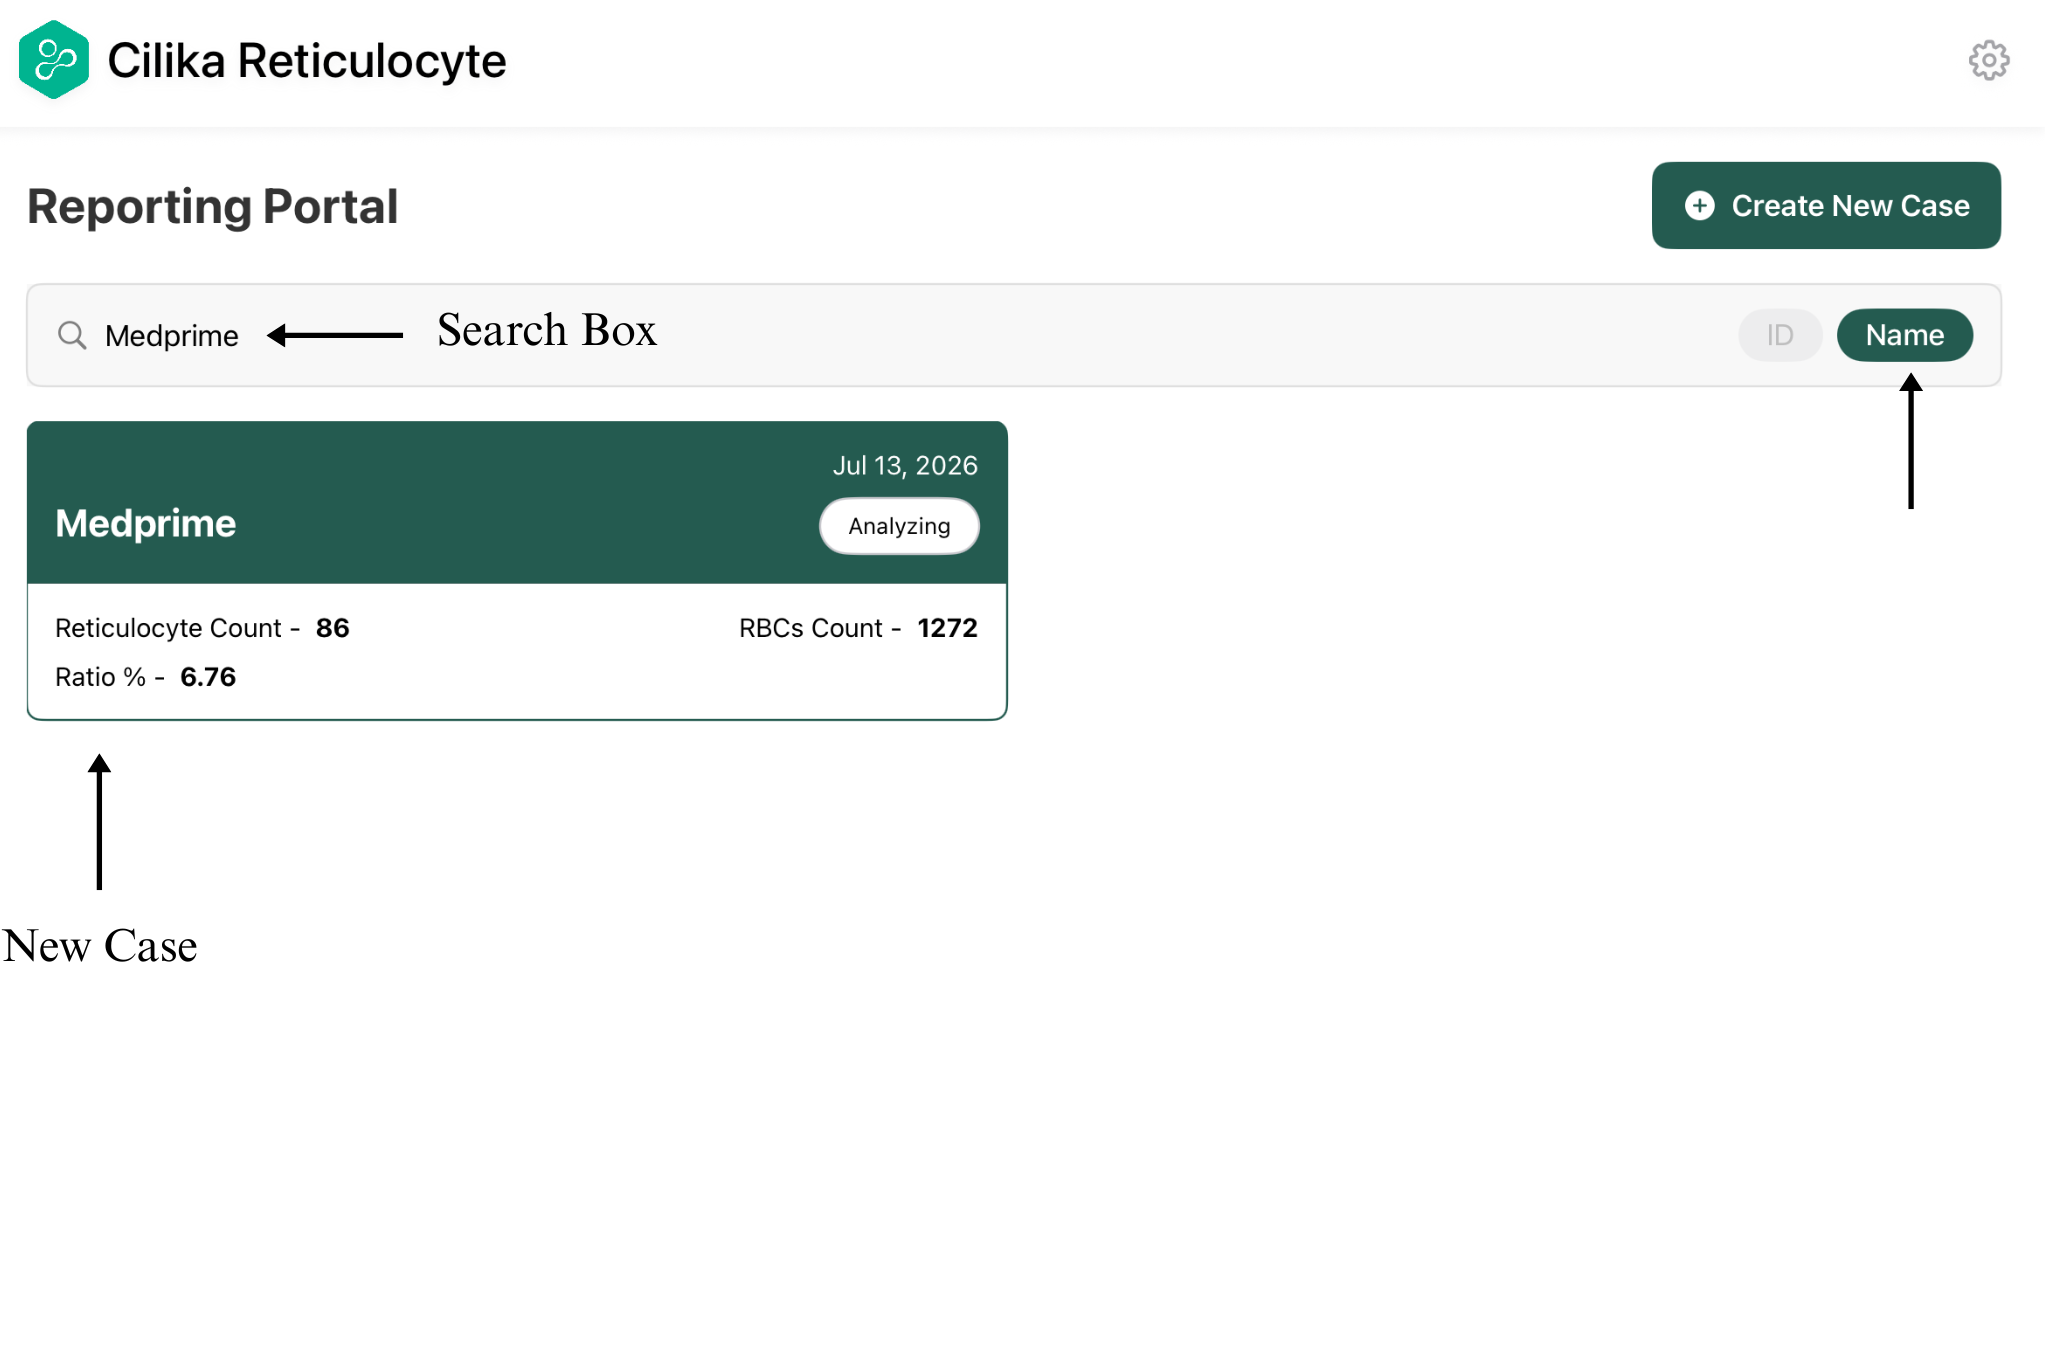
- Once the case is created, it is displayed as card on the dashboard.
- User can use the Search field to search for a specific case and also has the option to search by the patient’s NAME or ID.
- Each case card shows a basic review of information which includes:
- Case identifier or name.
- Date created or last updated.
- Current case status (e.g., Info Completed).
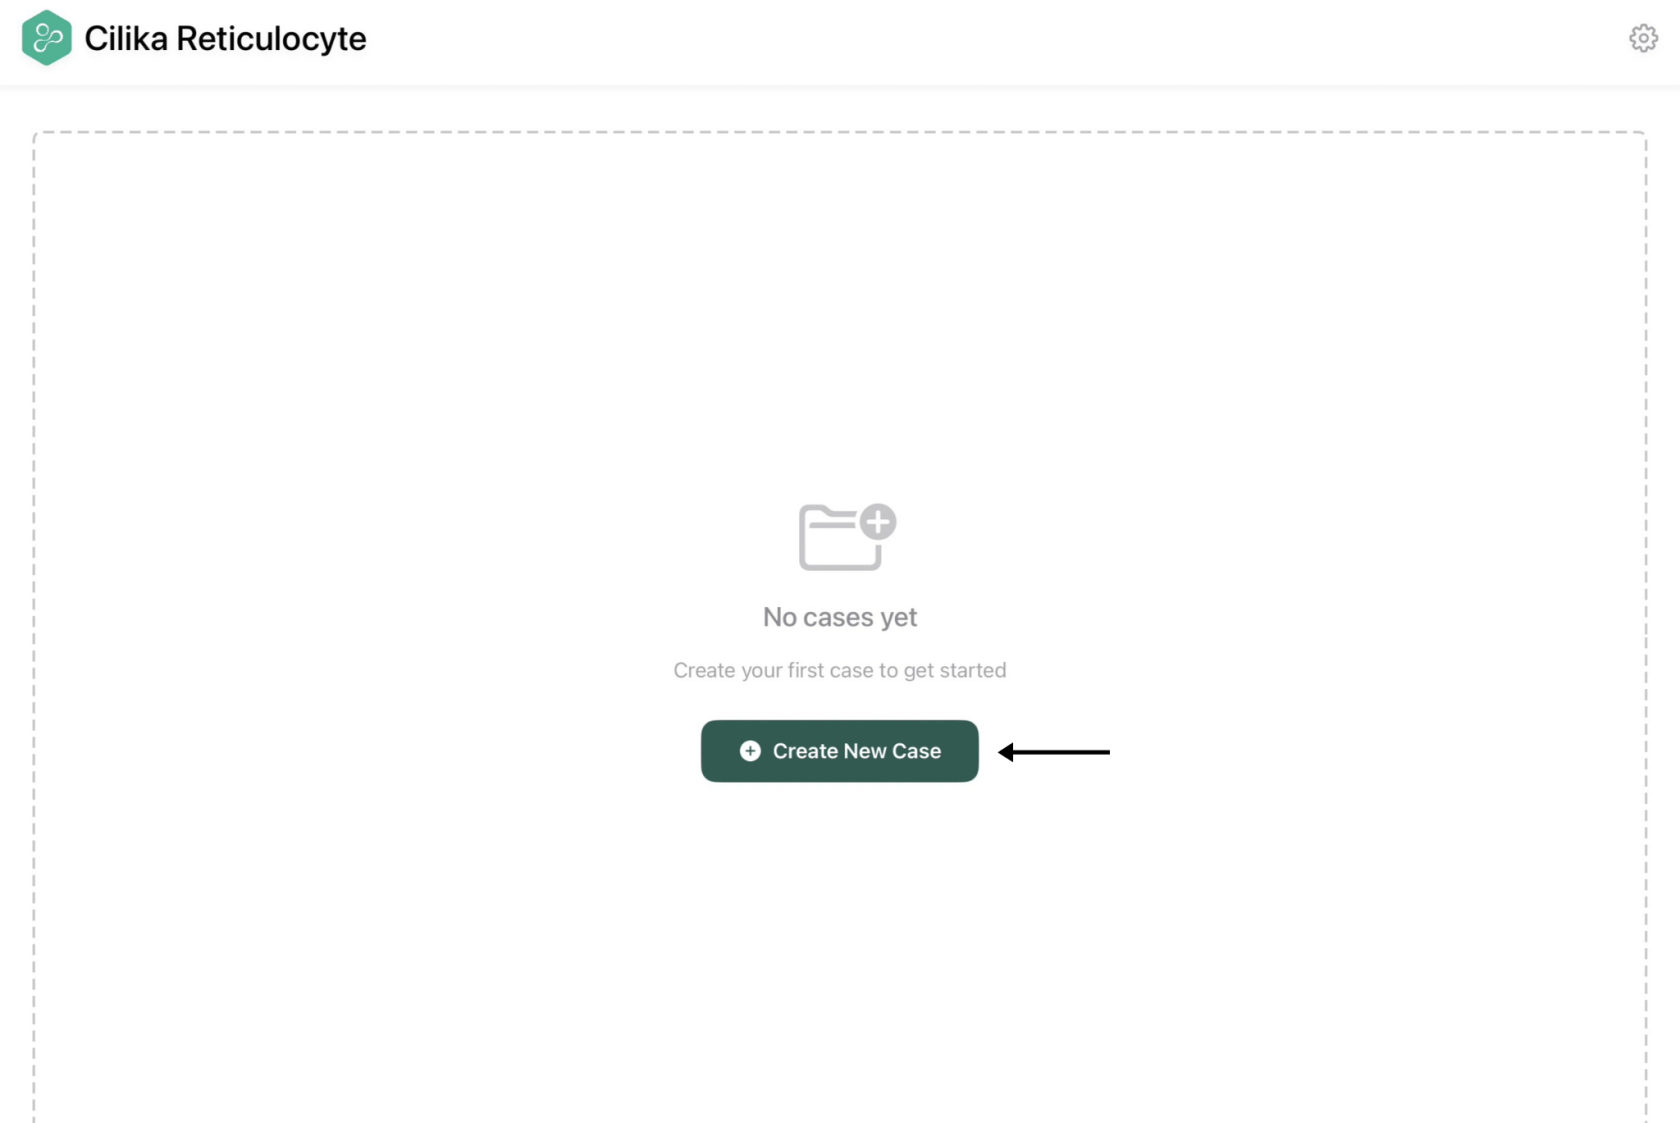
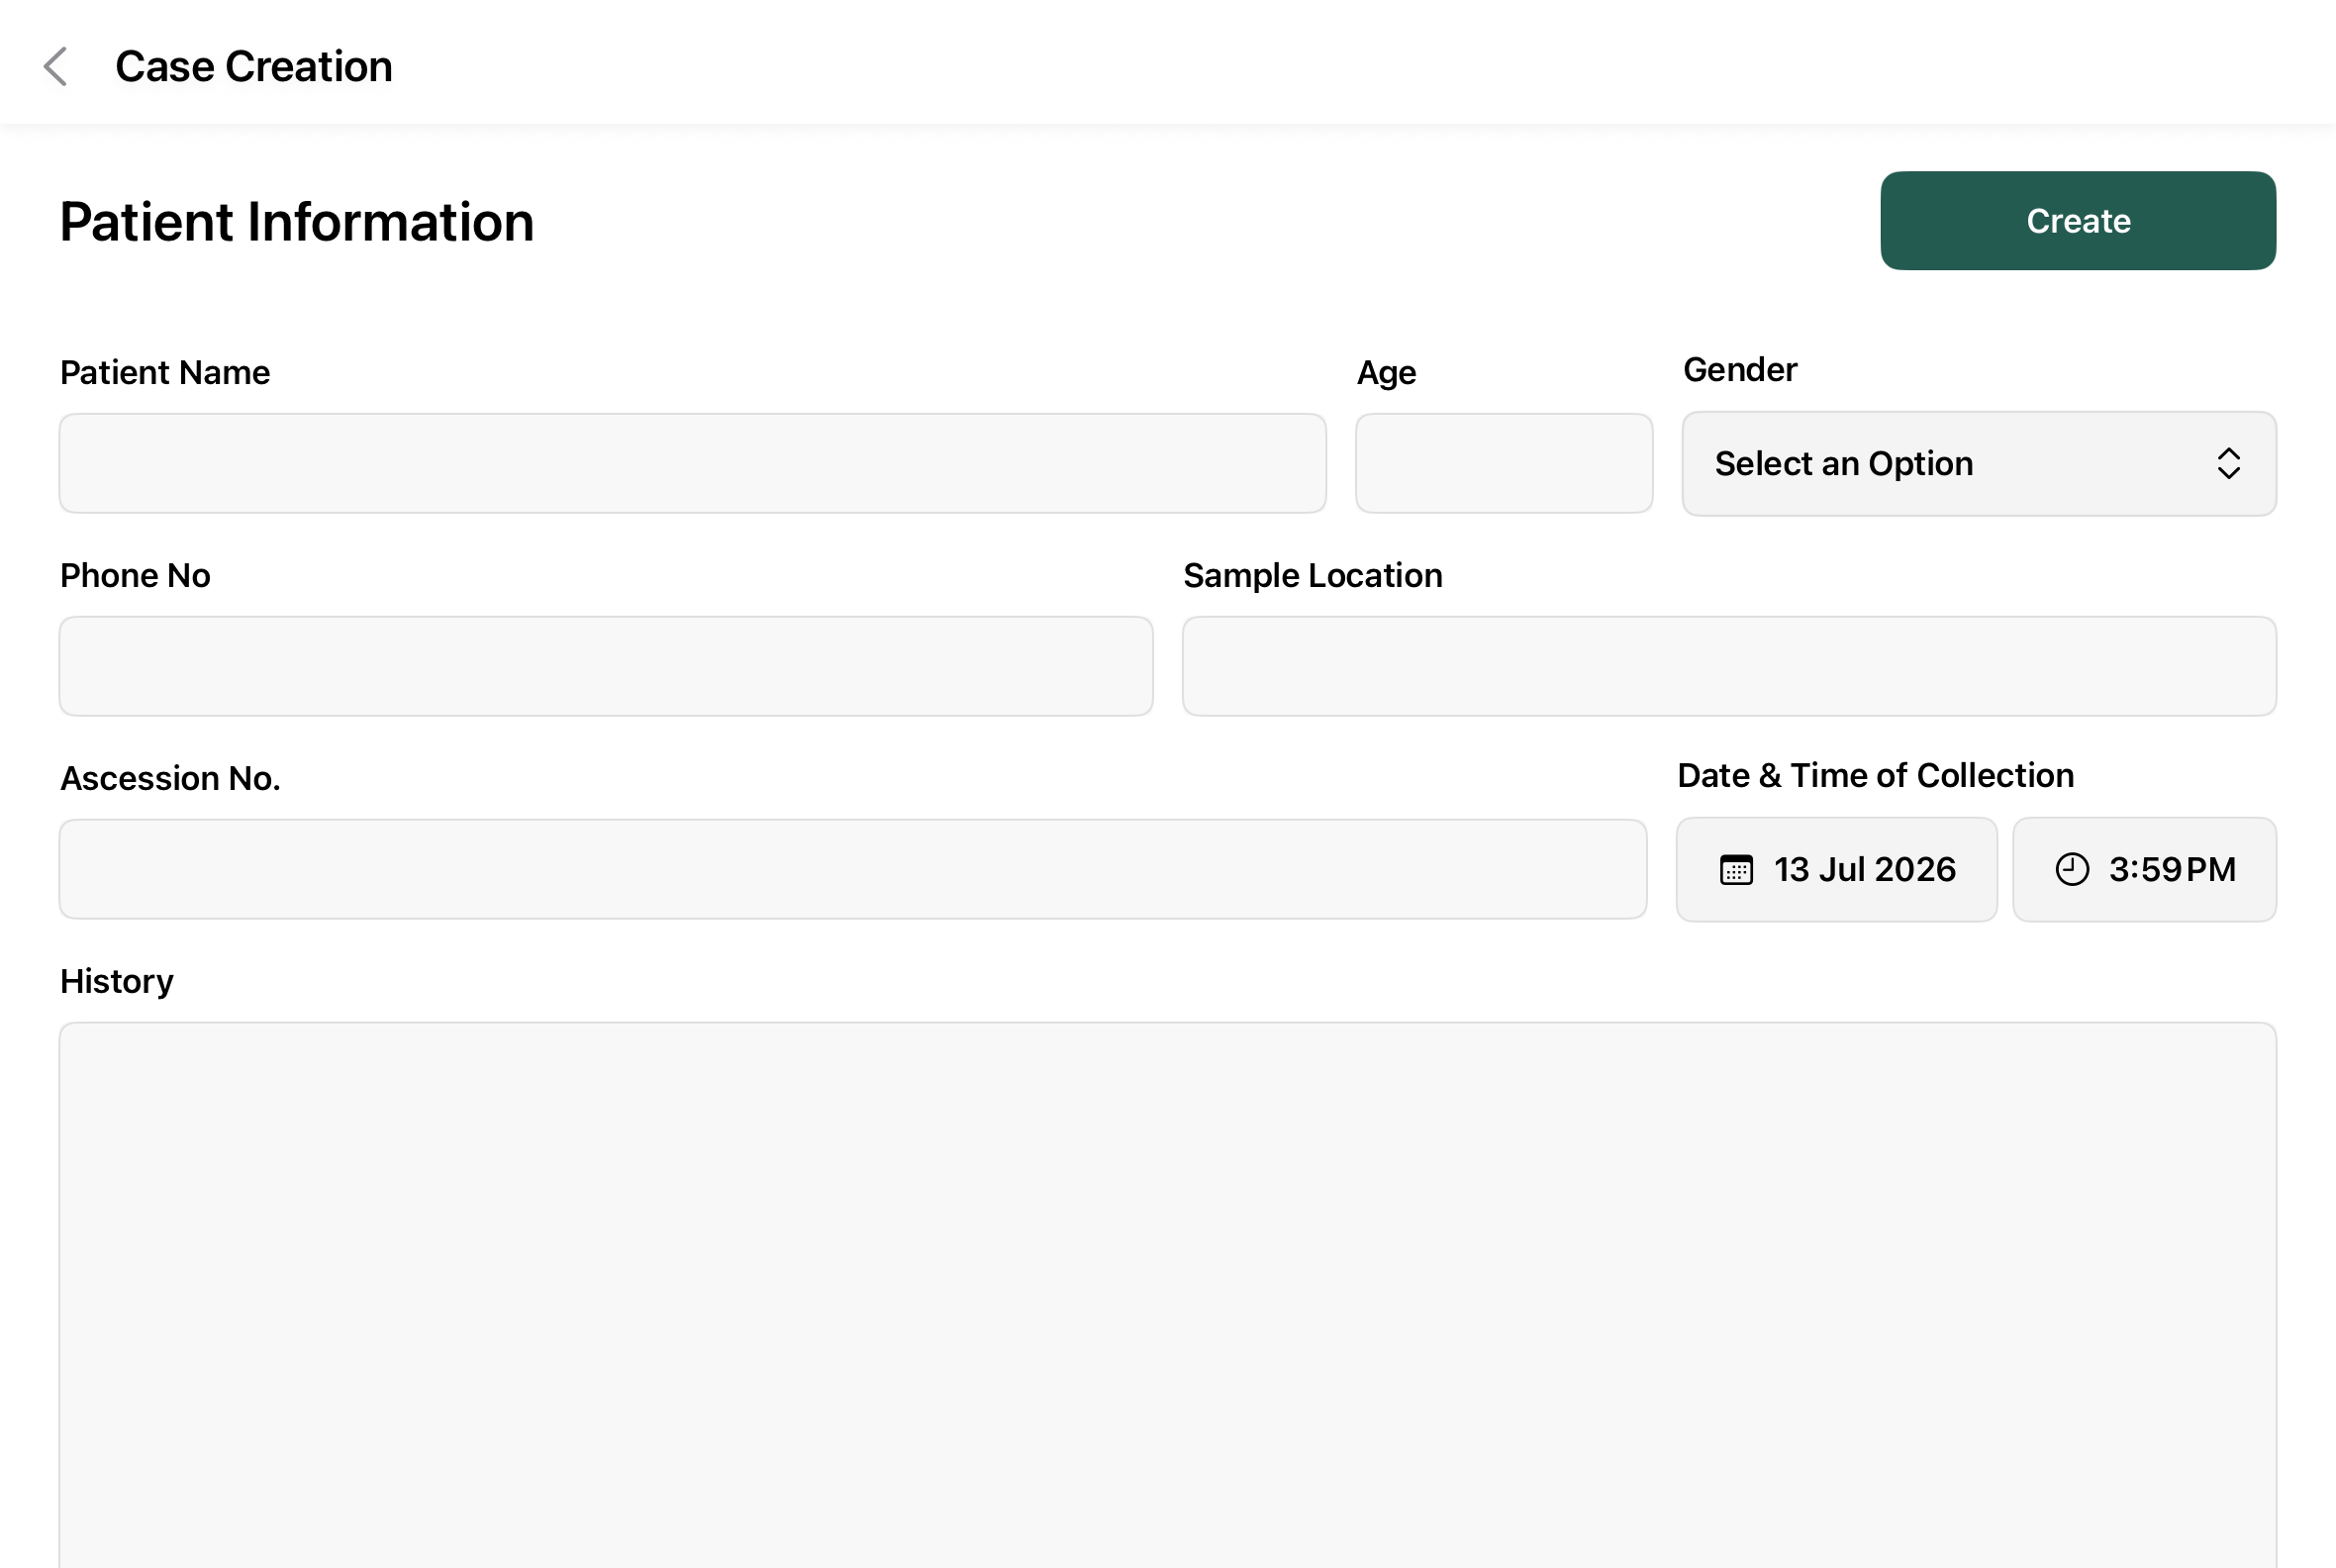 Figure 2.1
3. Existing Case
After creating a case, you can reopen it anytime from the Dashboard.
-
Open the Dashboard.
-
Locate the required case from the list.
-
Use the Search bar to search by ID or Name, if required.
-
Select the desired case to open it. The selected case opens, allowing you to continue image acquisition or review.
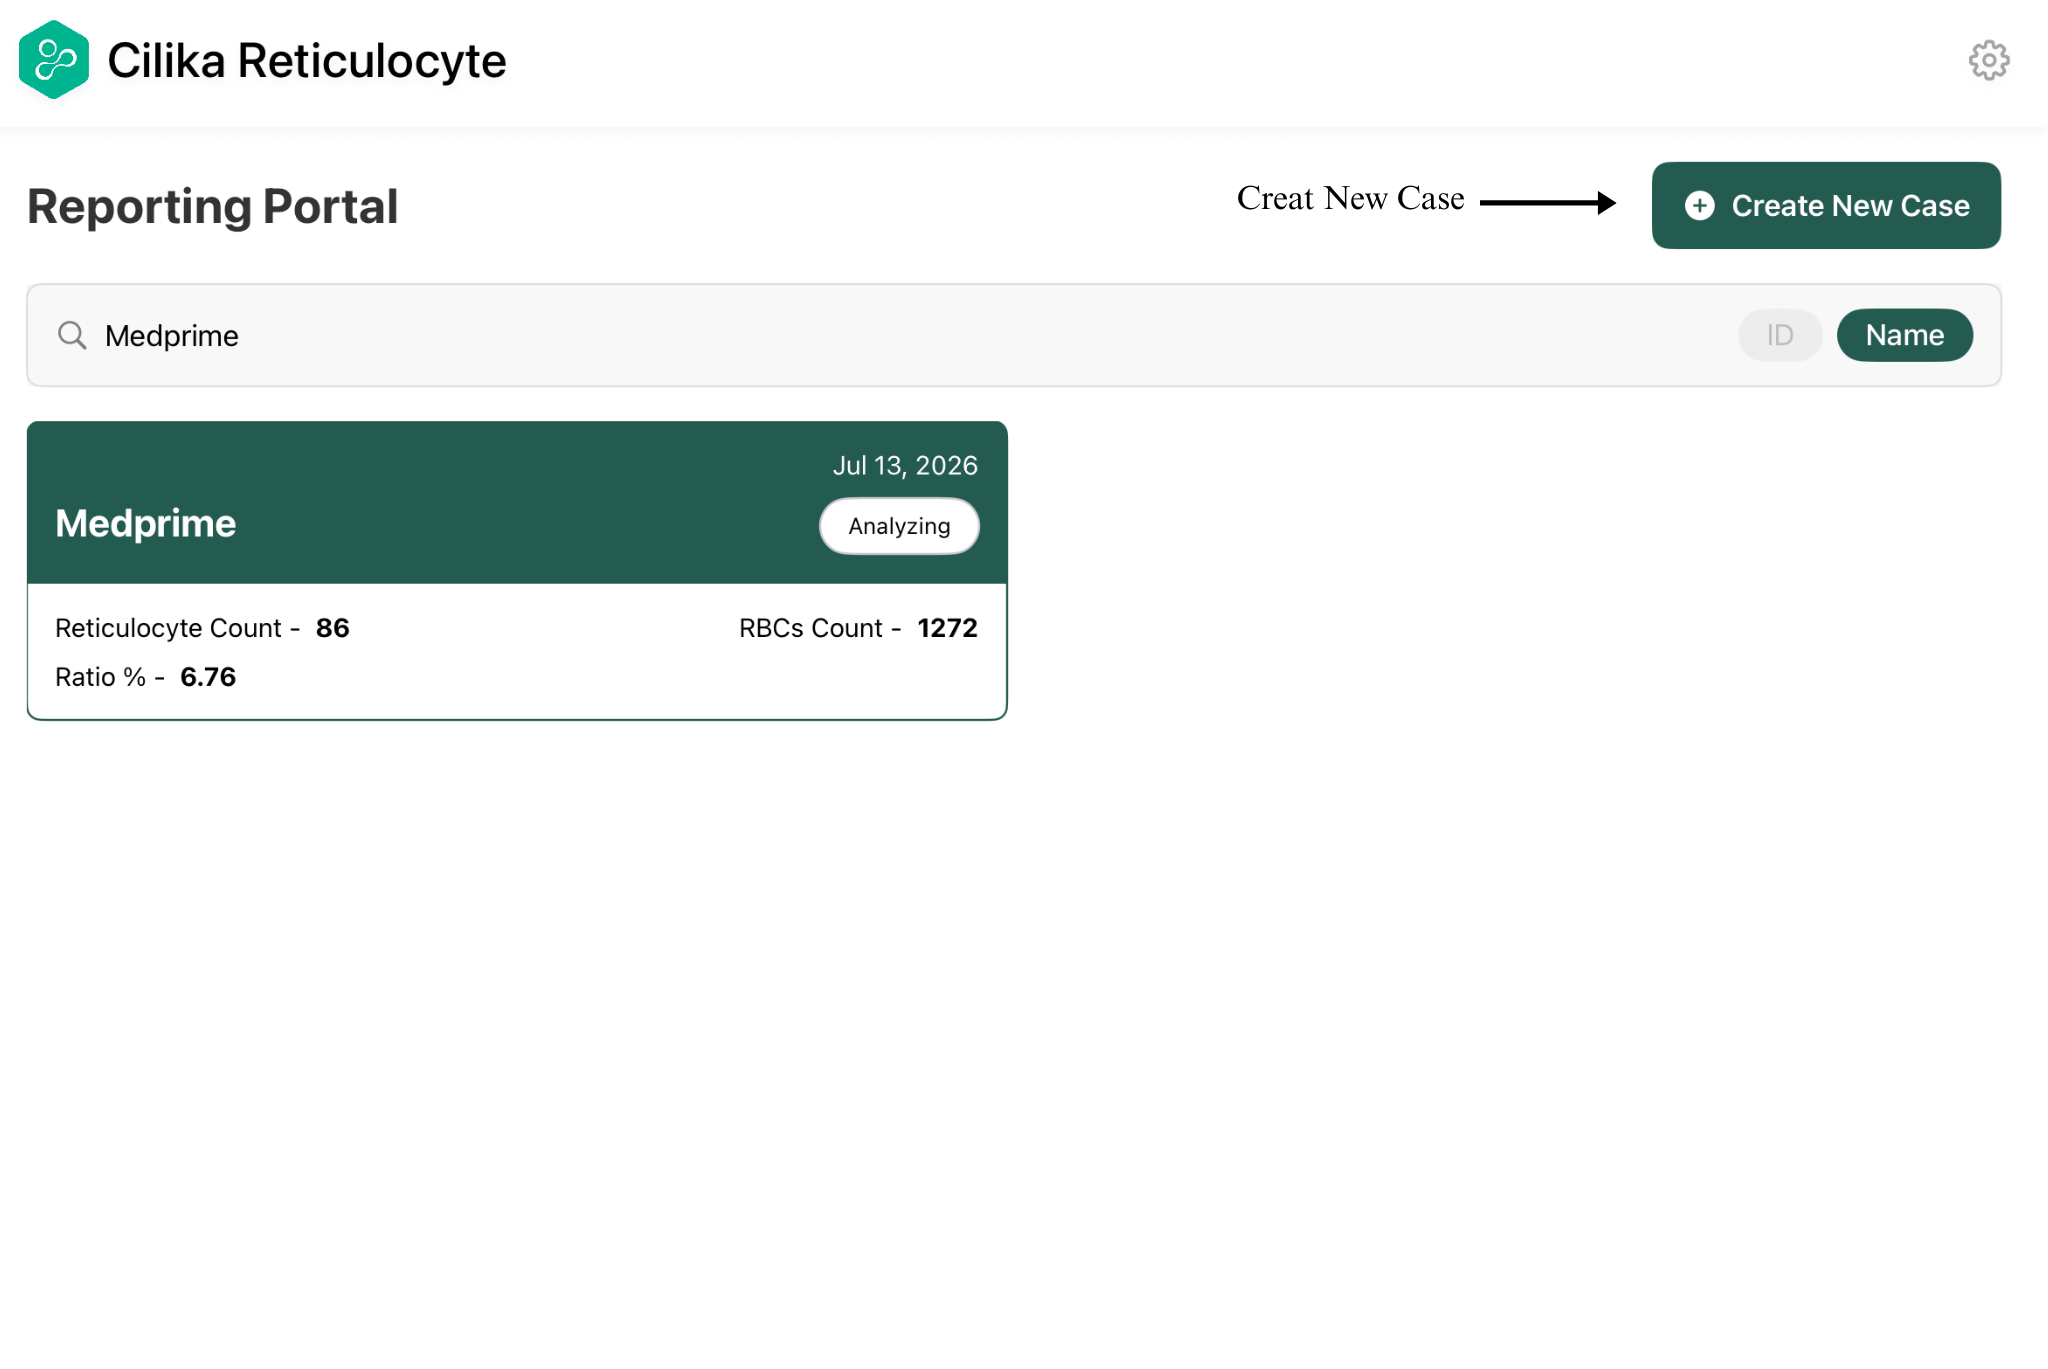
- You can also create a new case.
|
Figure 3 |
|
4.Capture Images
The Image Capture screen is used to acquire microscope images for analysis.
-
Open the required patient case.
-
Review the summary counters displayed at the top of the screen:
-
Retic Count
-
RBC Count
-
Ratio (%)
-
FOVs
-
-
If no images have been captured, you will find Capture Image option once you open a case.
-
Position the microscope field clearly within the camera view.
-
The capture view has camera settings labeled as tools on the left.
-
The tools are set to auto manually but can be adjusted by tapping on the auto button.
-
Tools include:
-
Focus
-
Exposure
-
White Balance
-
-
Once the camera settings have been adjusted, tap the Capture button to capture an image.
-
Continue capturing images until the required number of Fields of View (FOVs) is reached.
- The Fields of View (FOVs) can be set by the user. The minimum FOVs are 10.
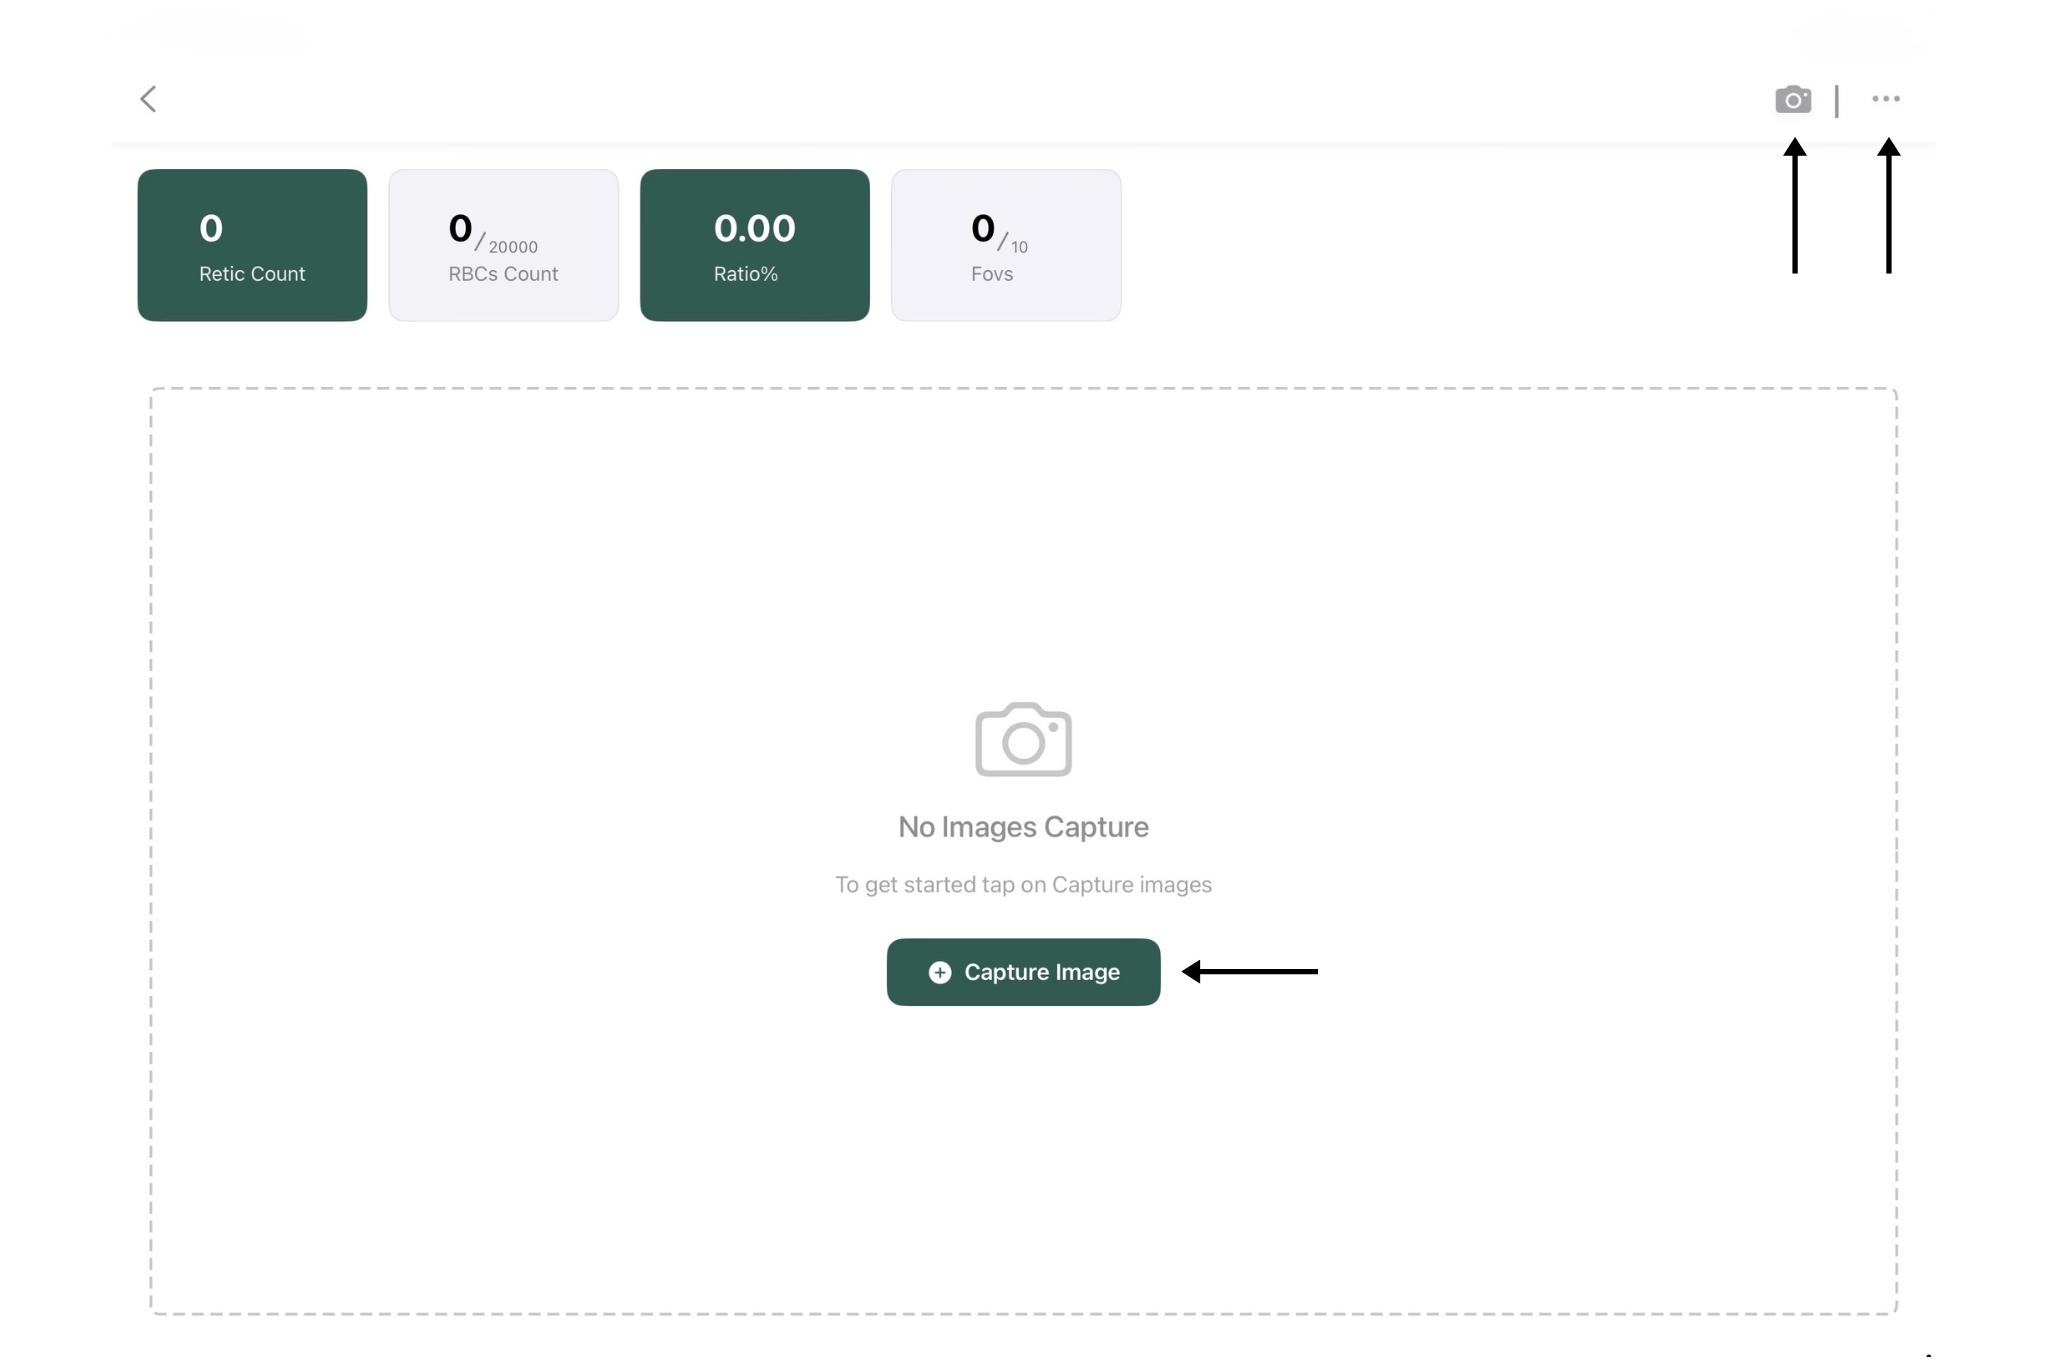
Figure 4
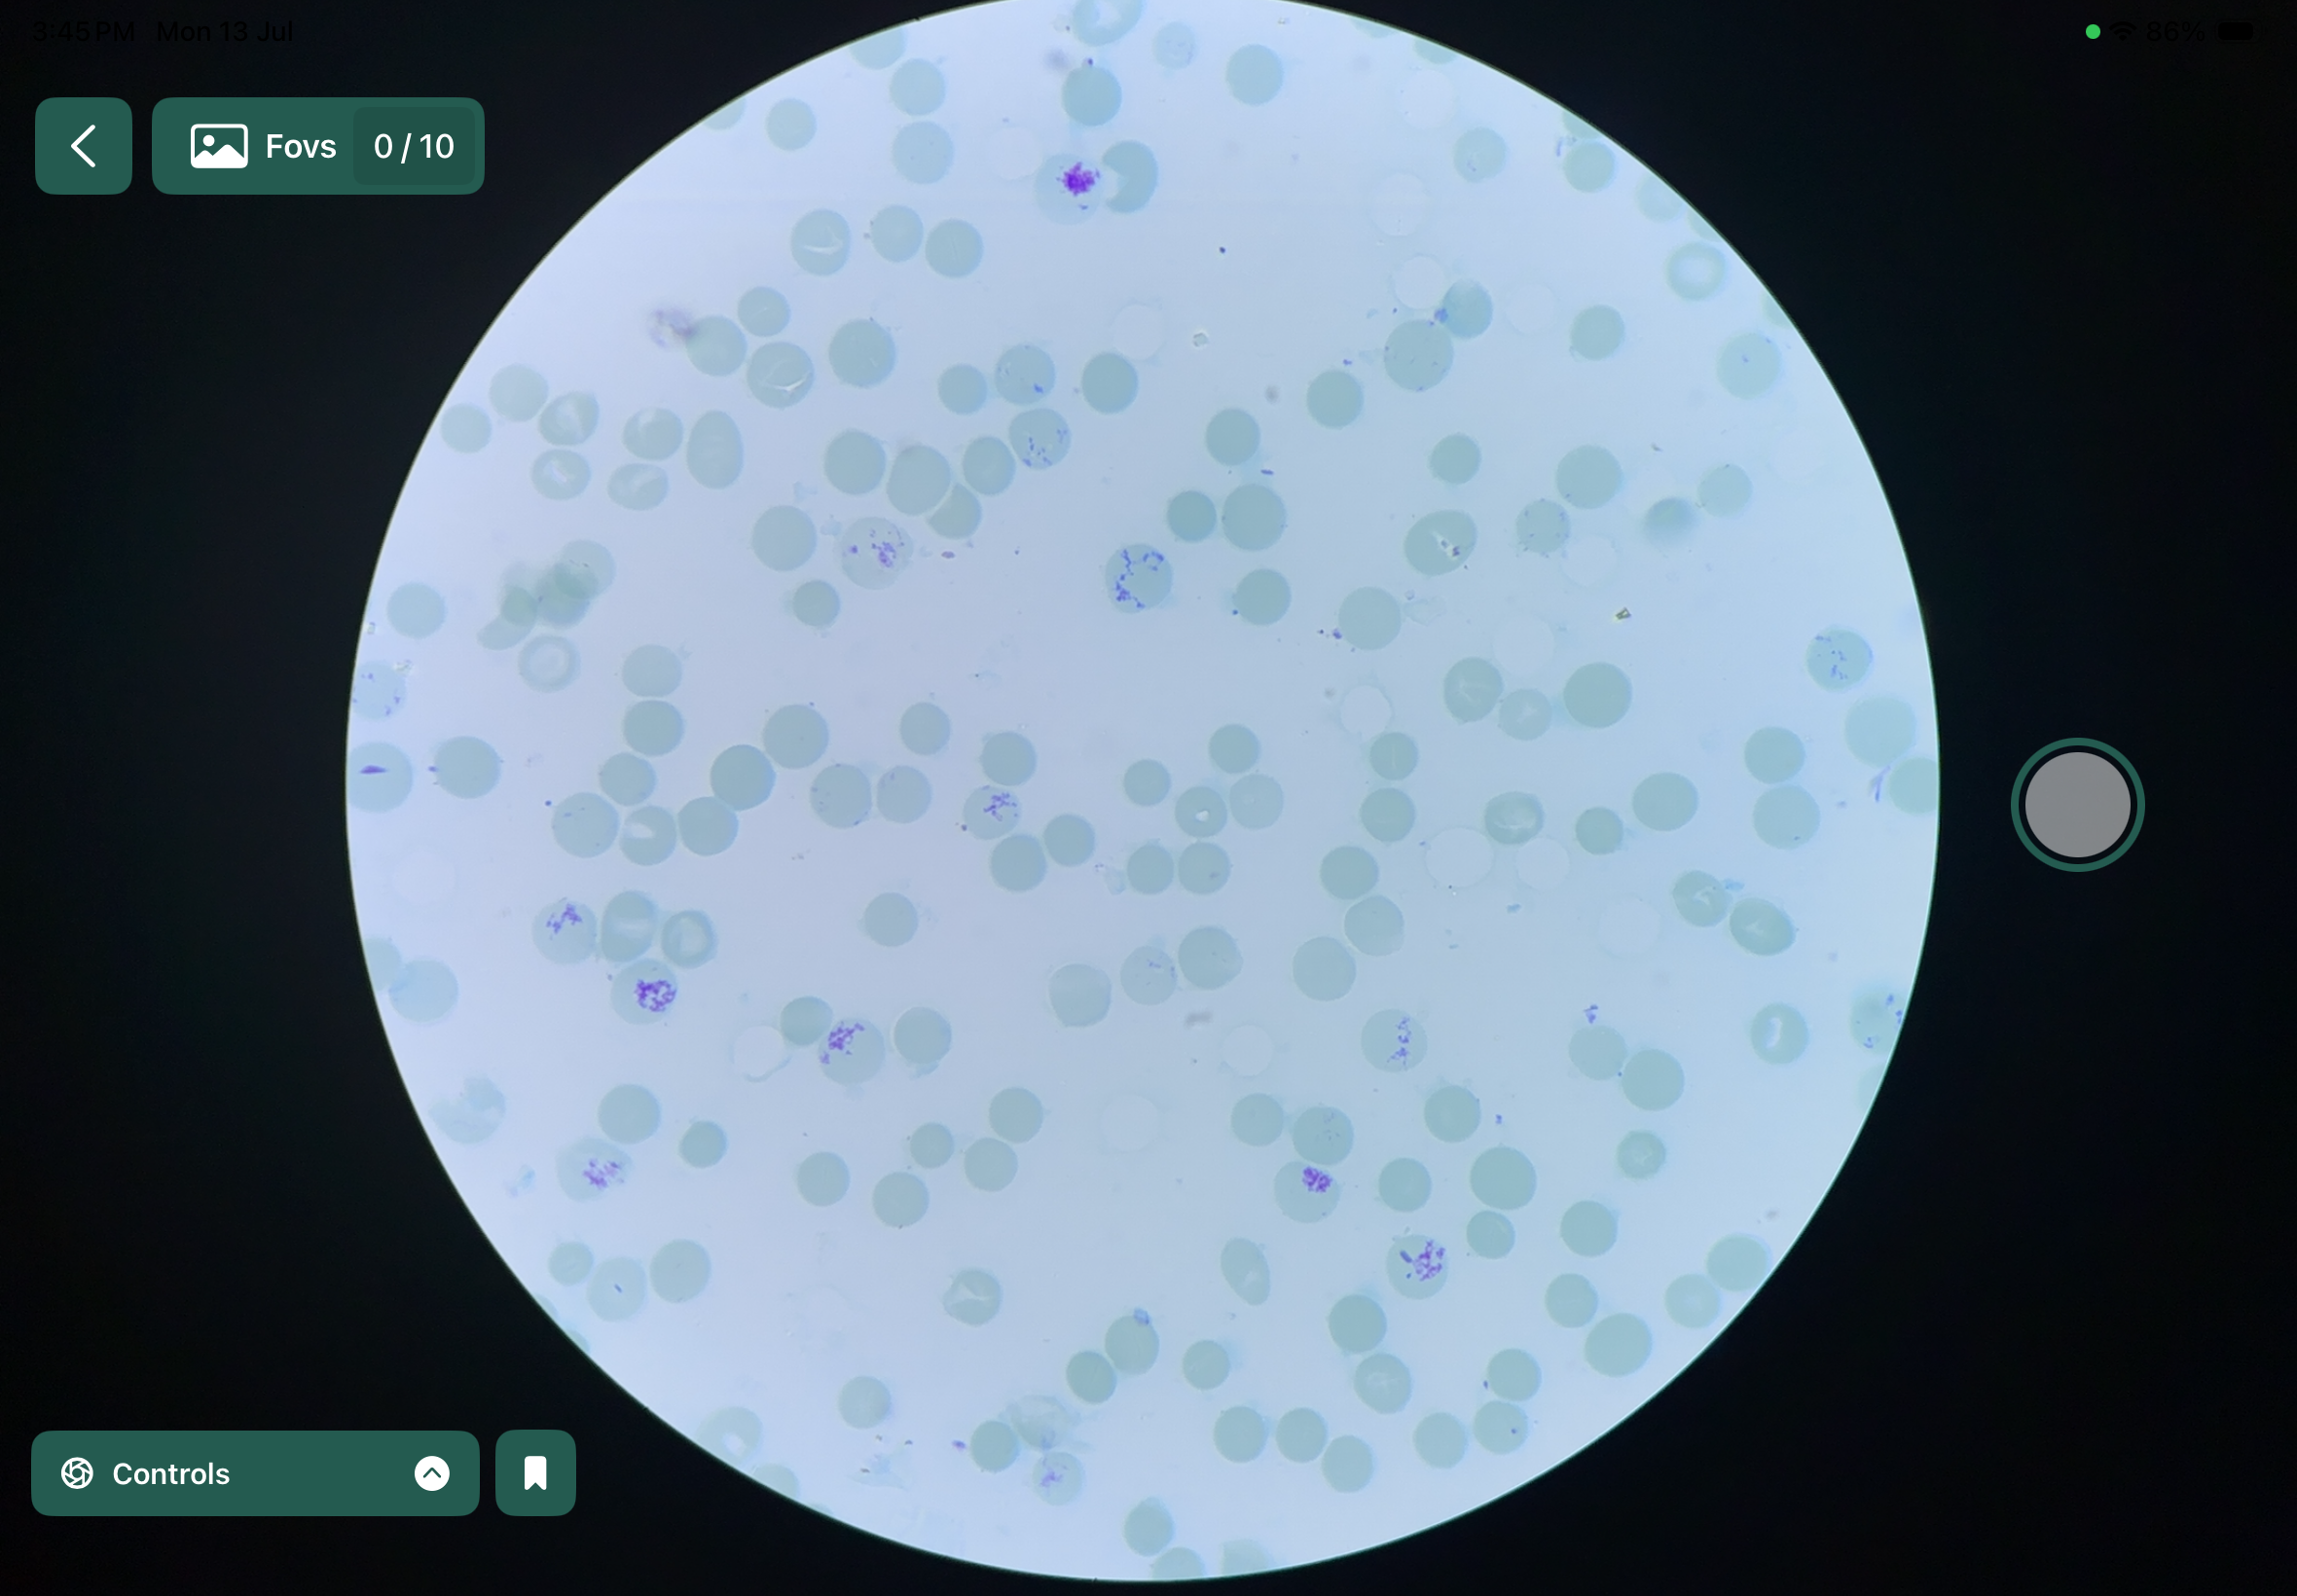
Figure 4.1
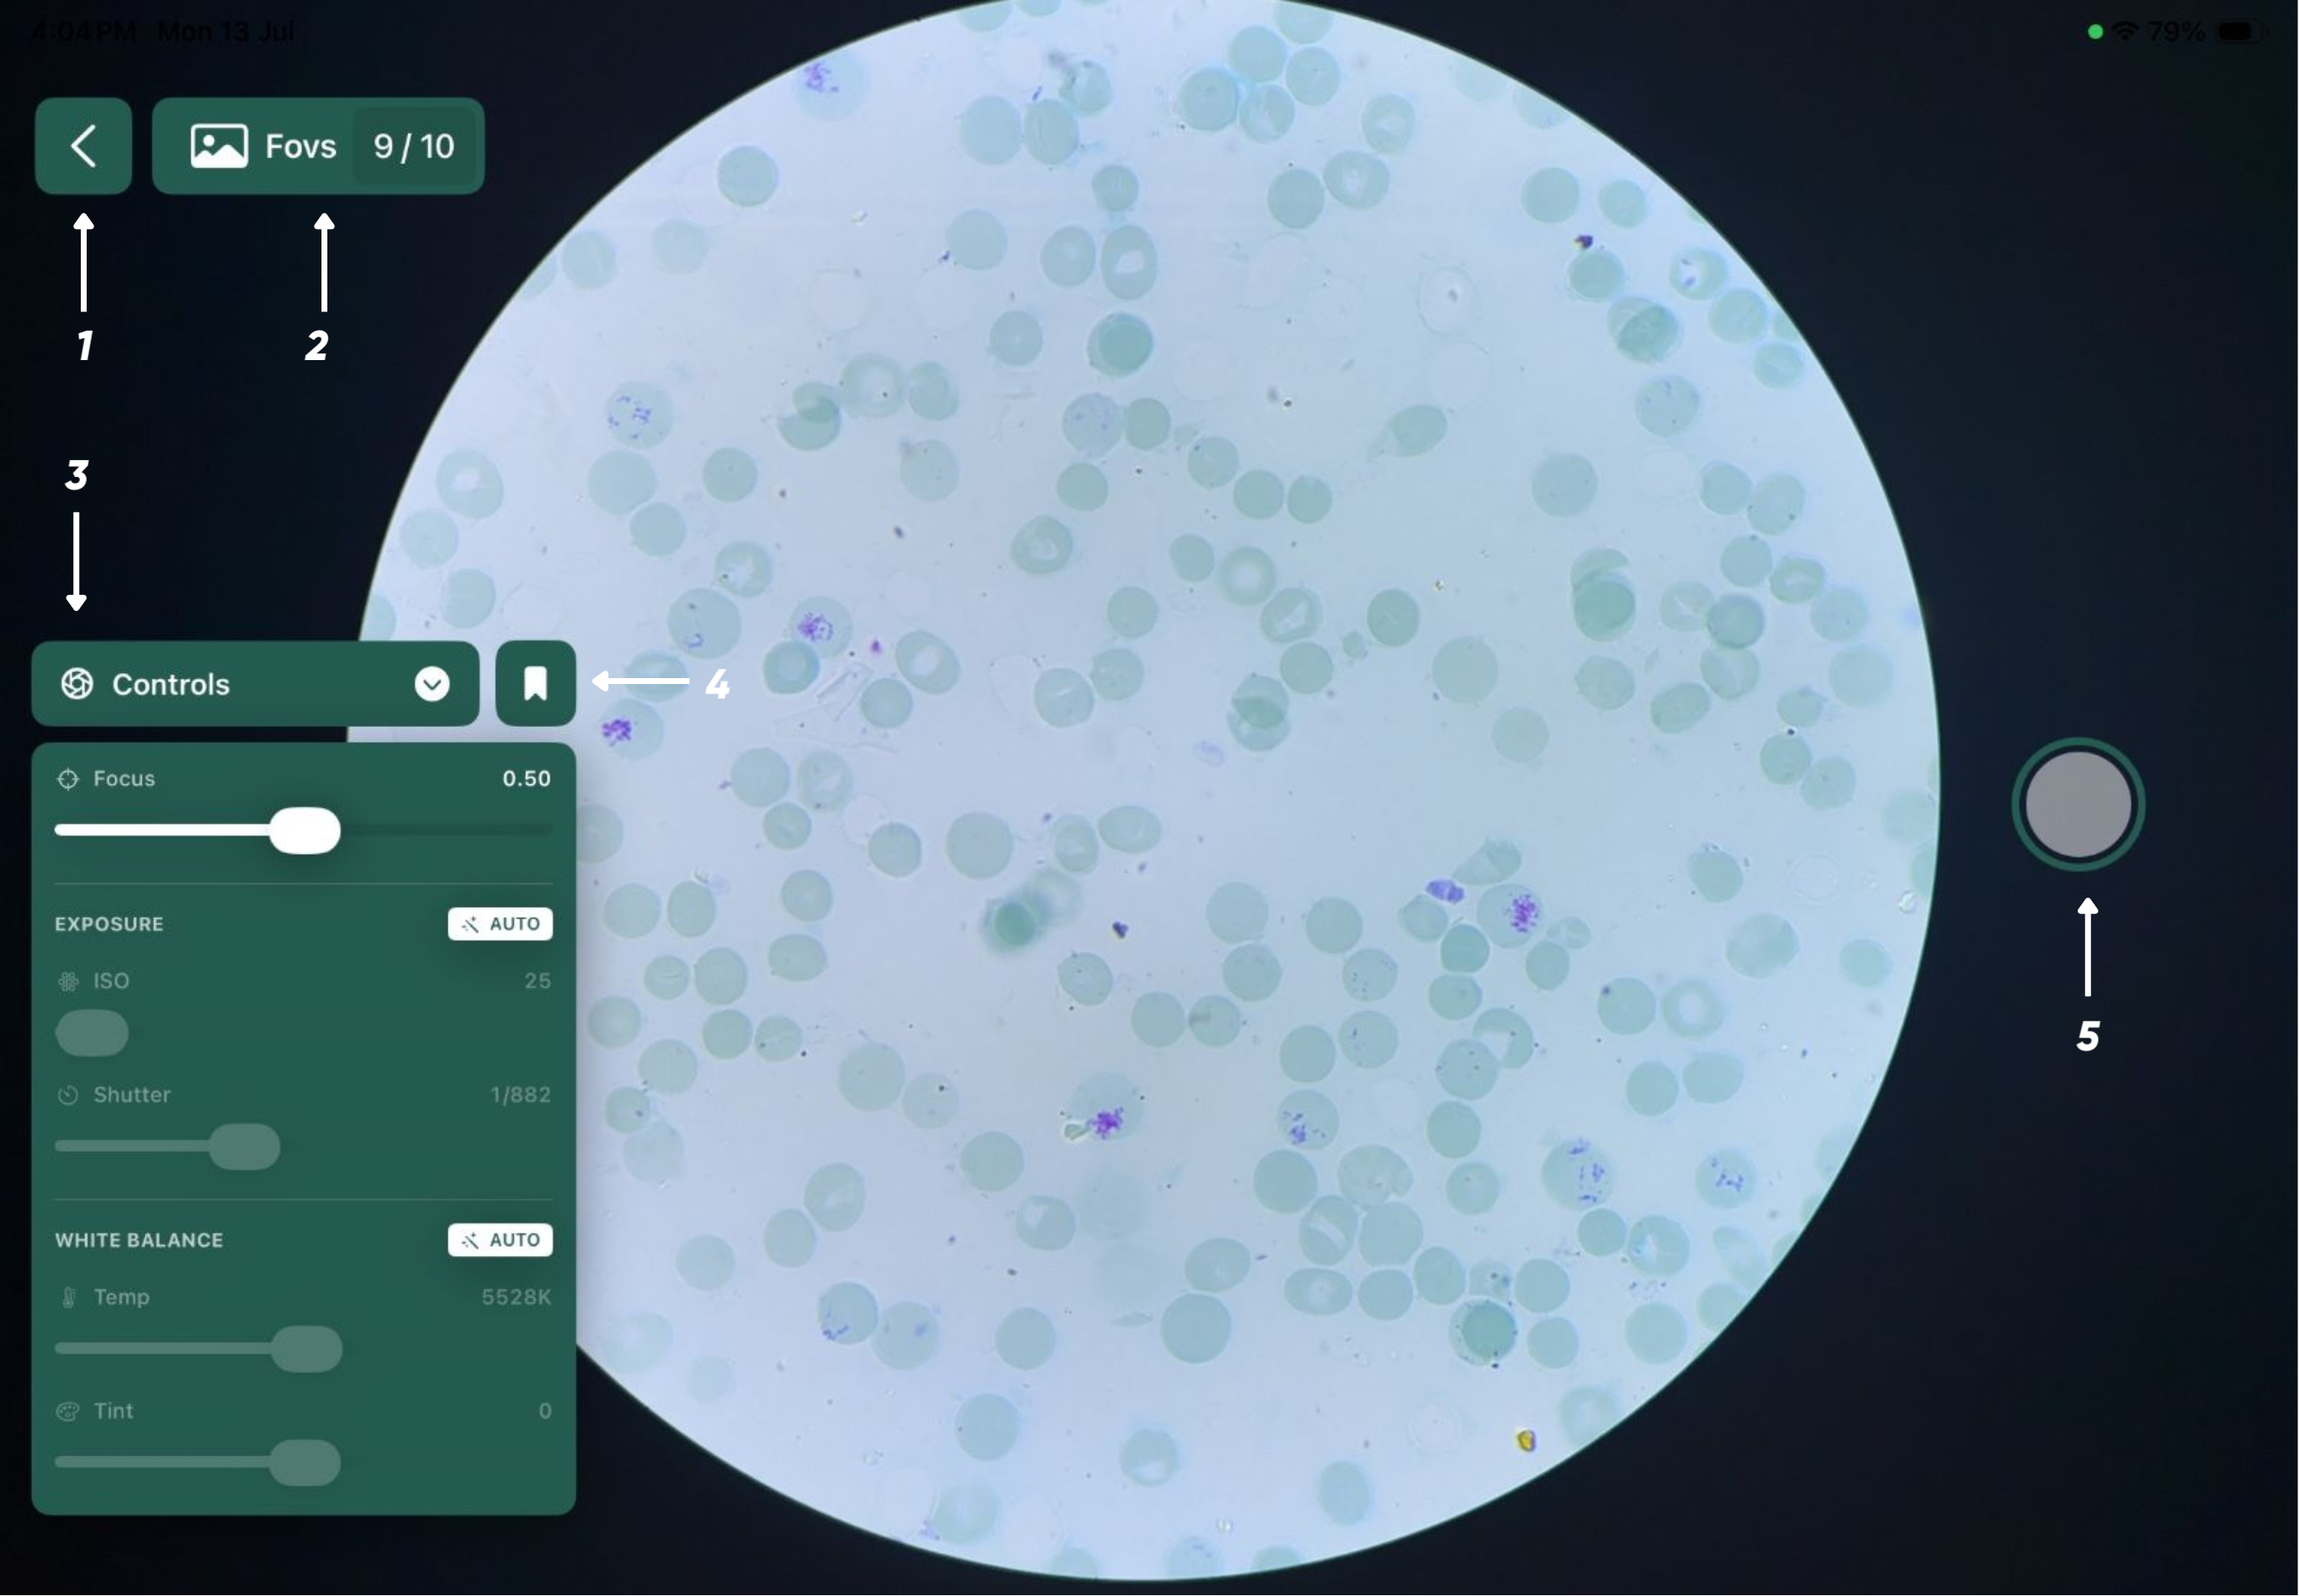
Figure 4.2
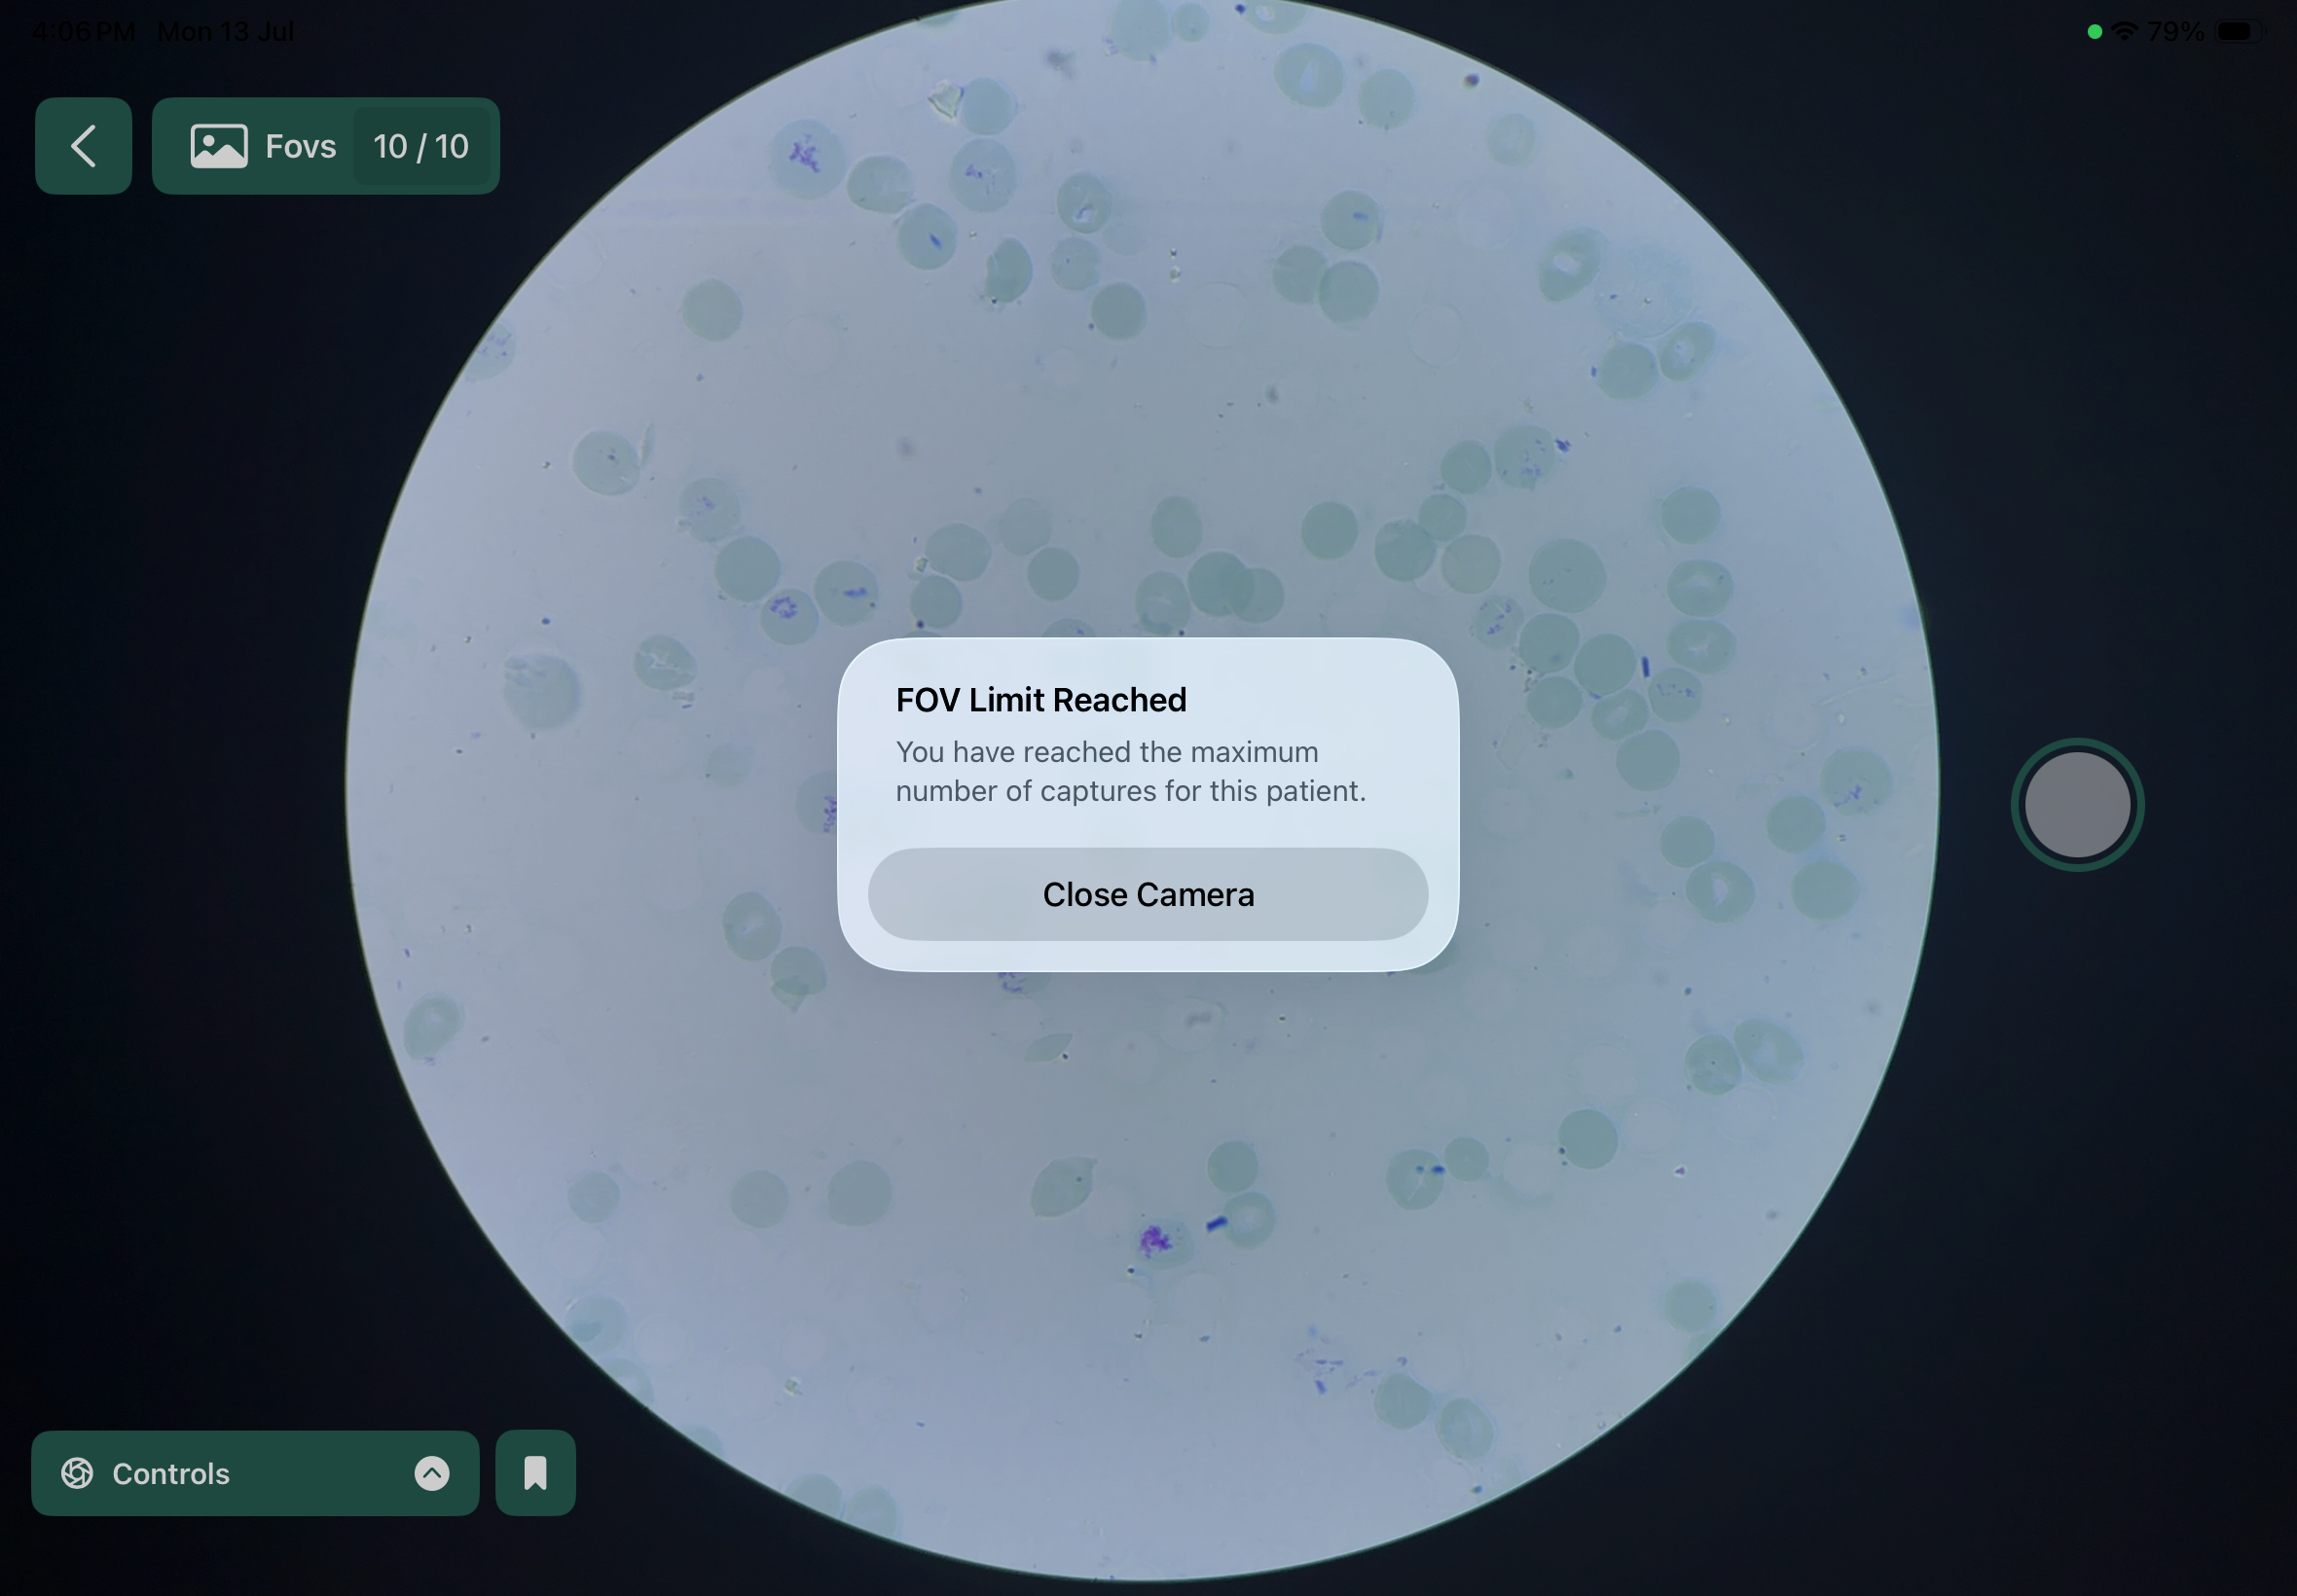
Figure 4.3
5. Incomplete POV
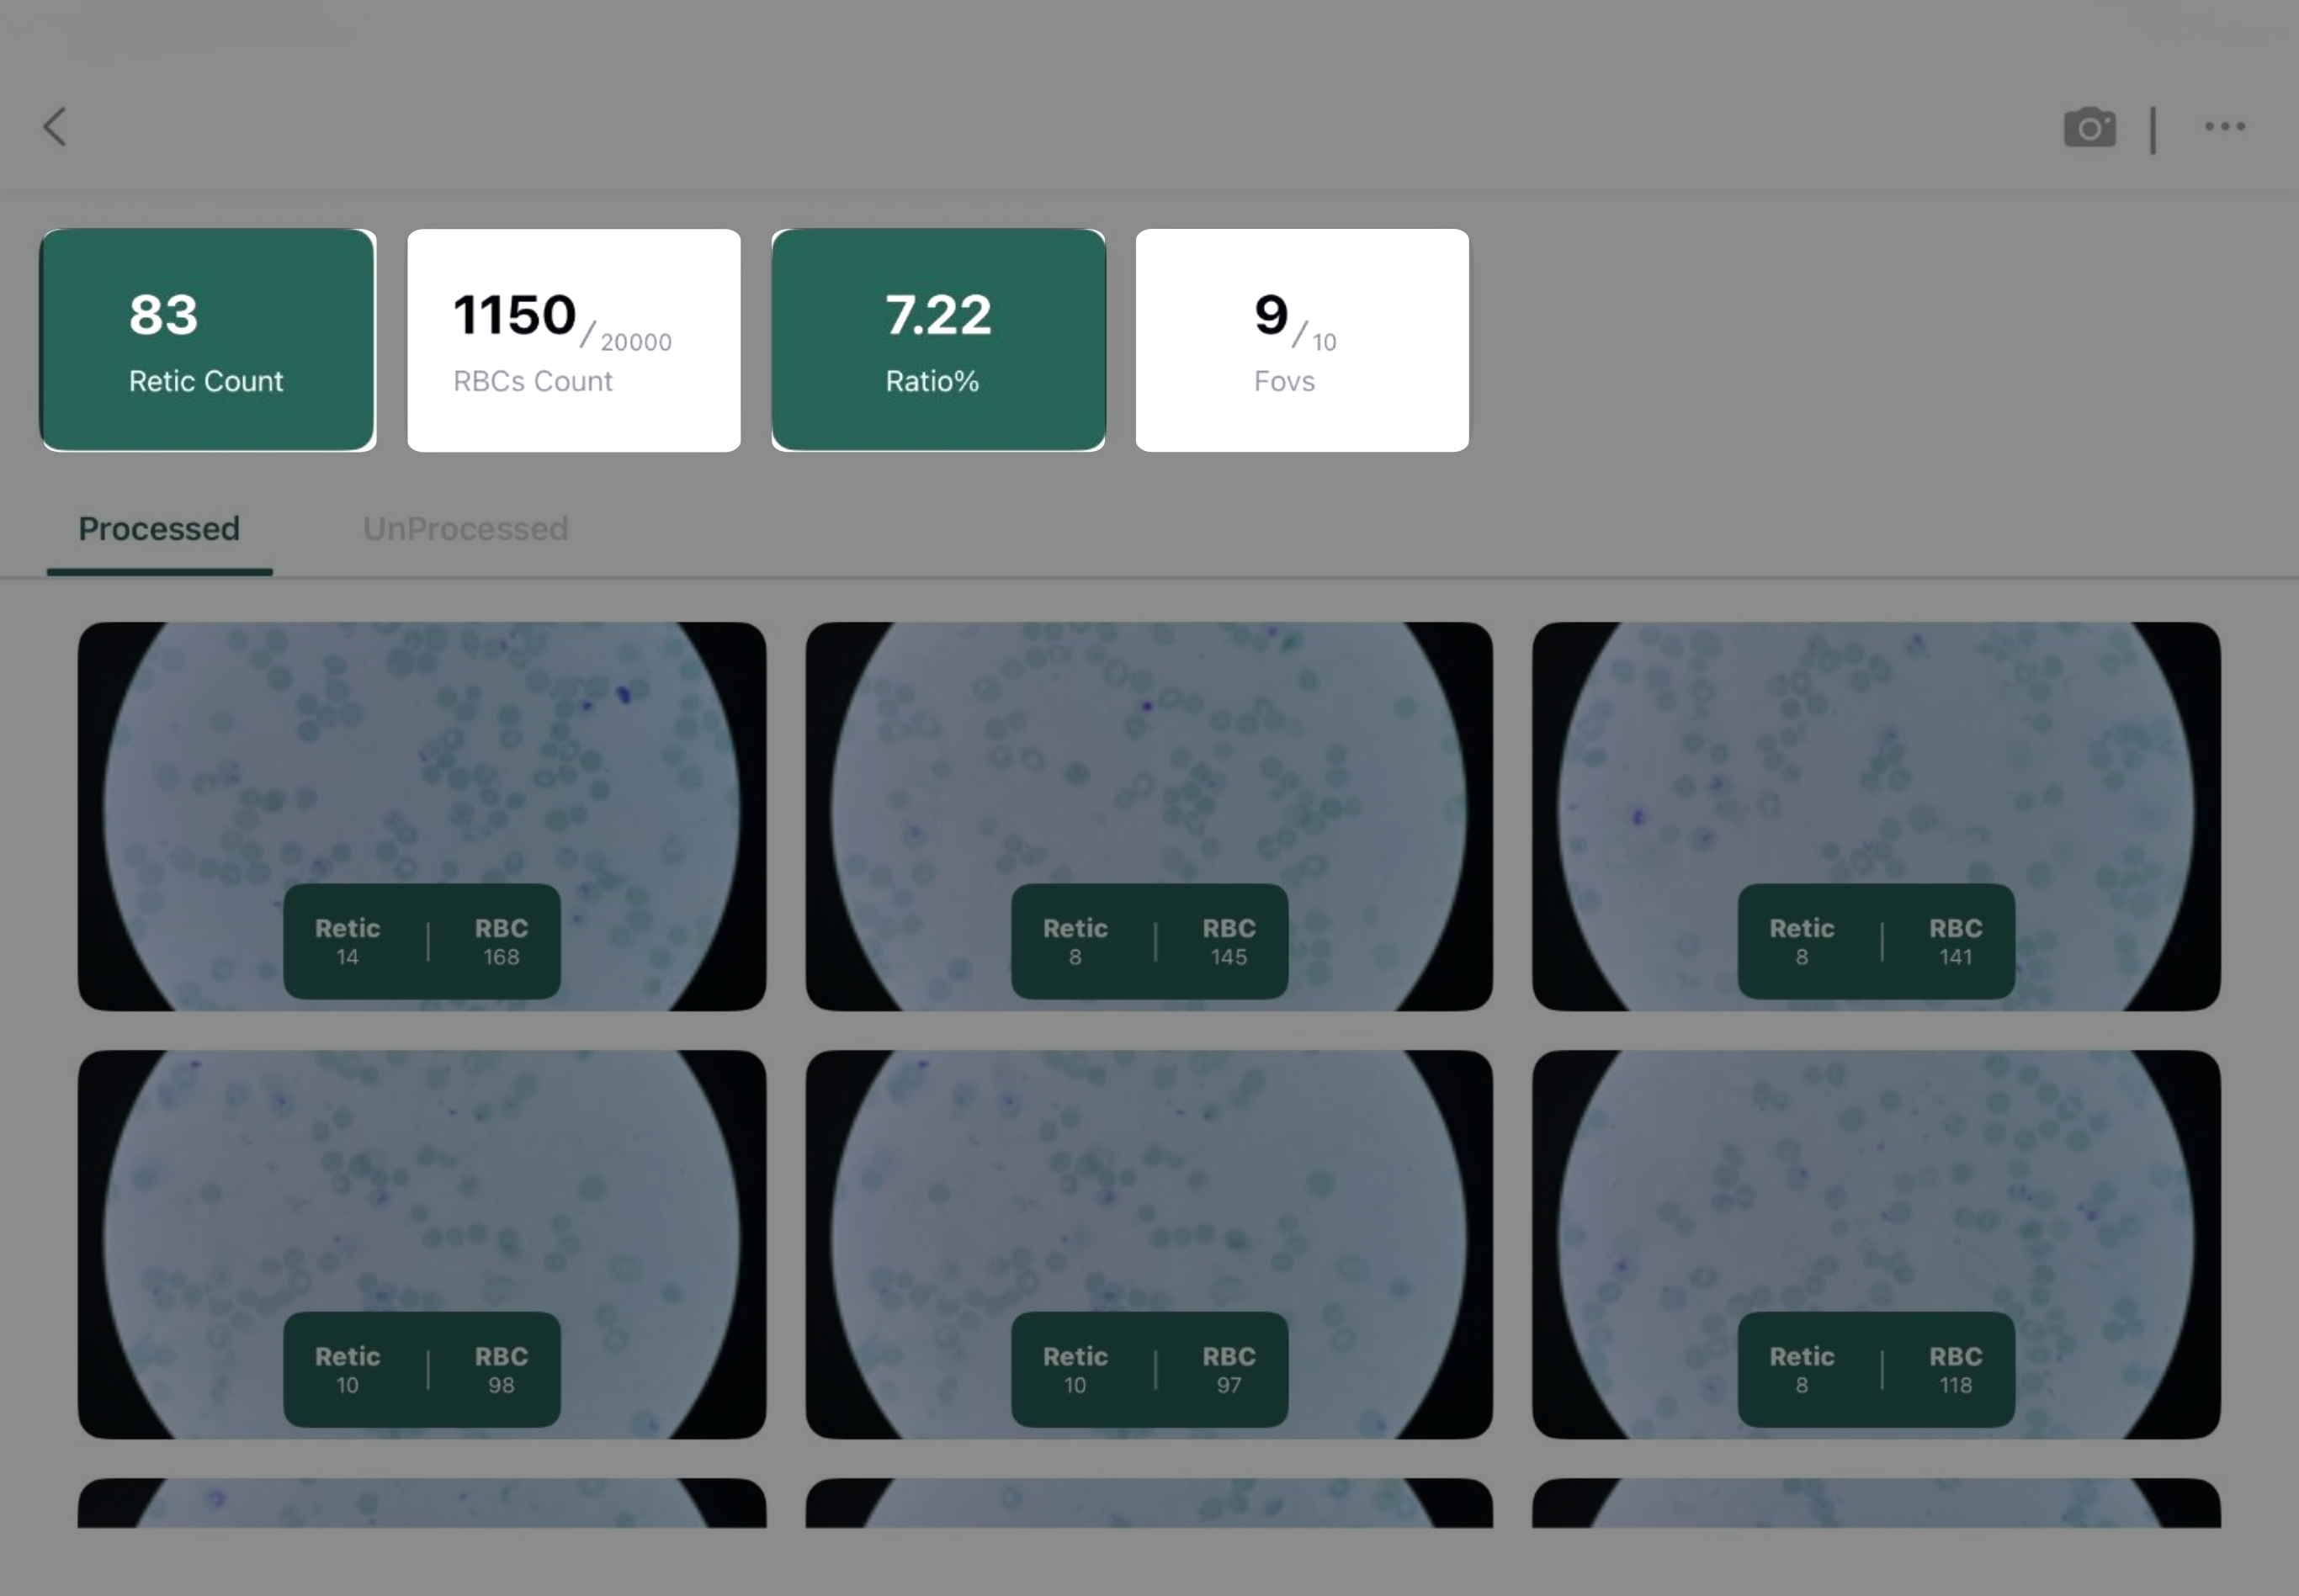
- If the FOV limit is not full filled, the user can find the the capture image button at the top right corner of the previous page.
- Once the FOV limit is reached, the button disappears.
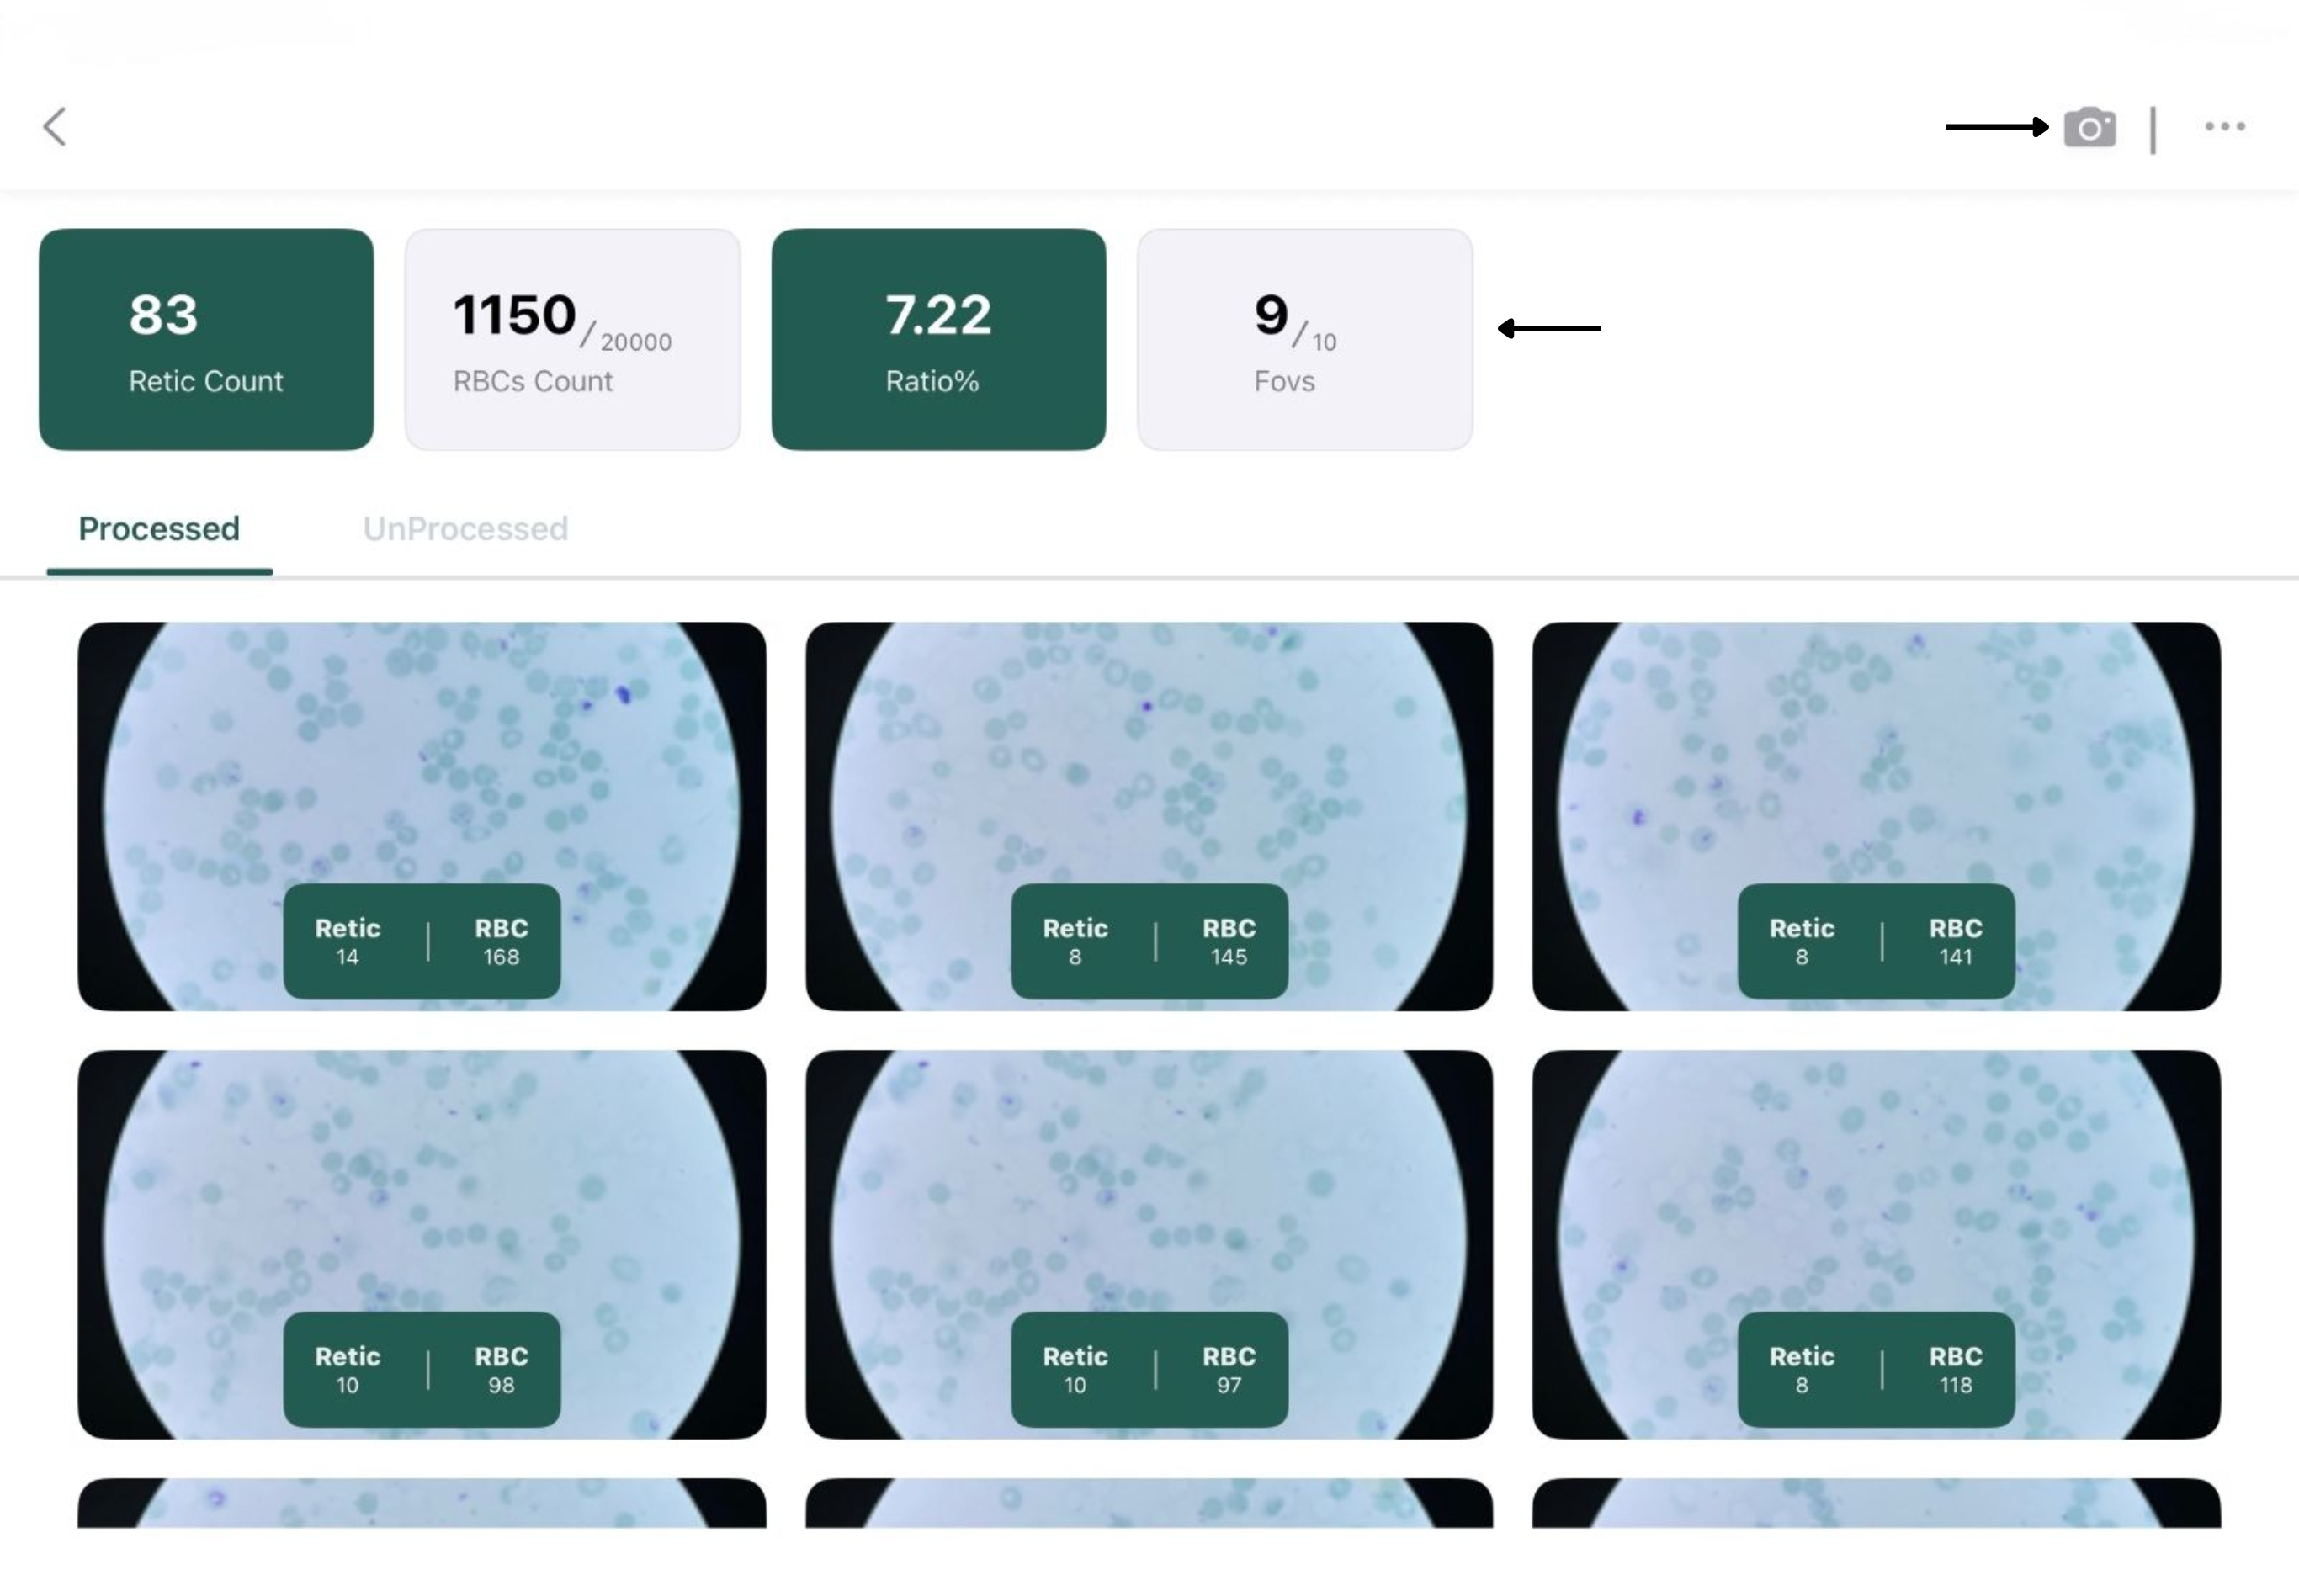 Figure 5 |
6. Review Captured Images
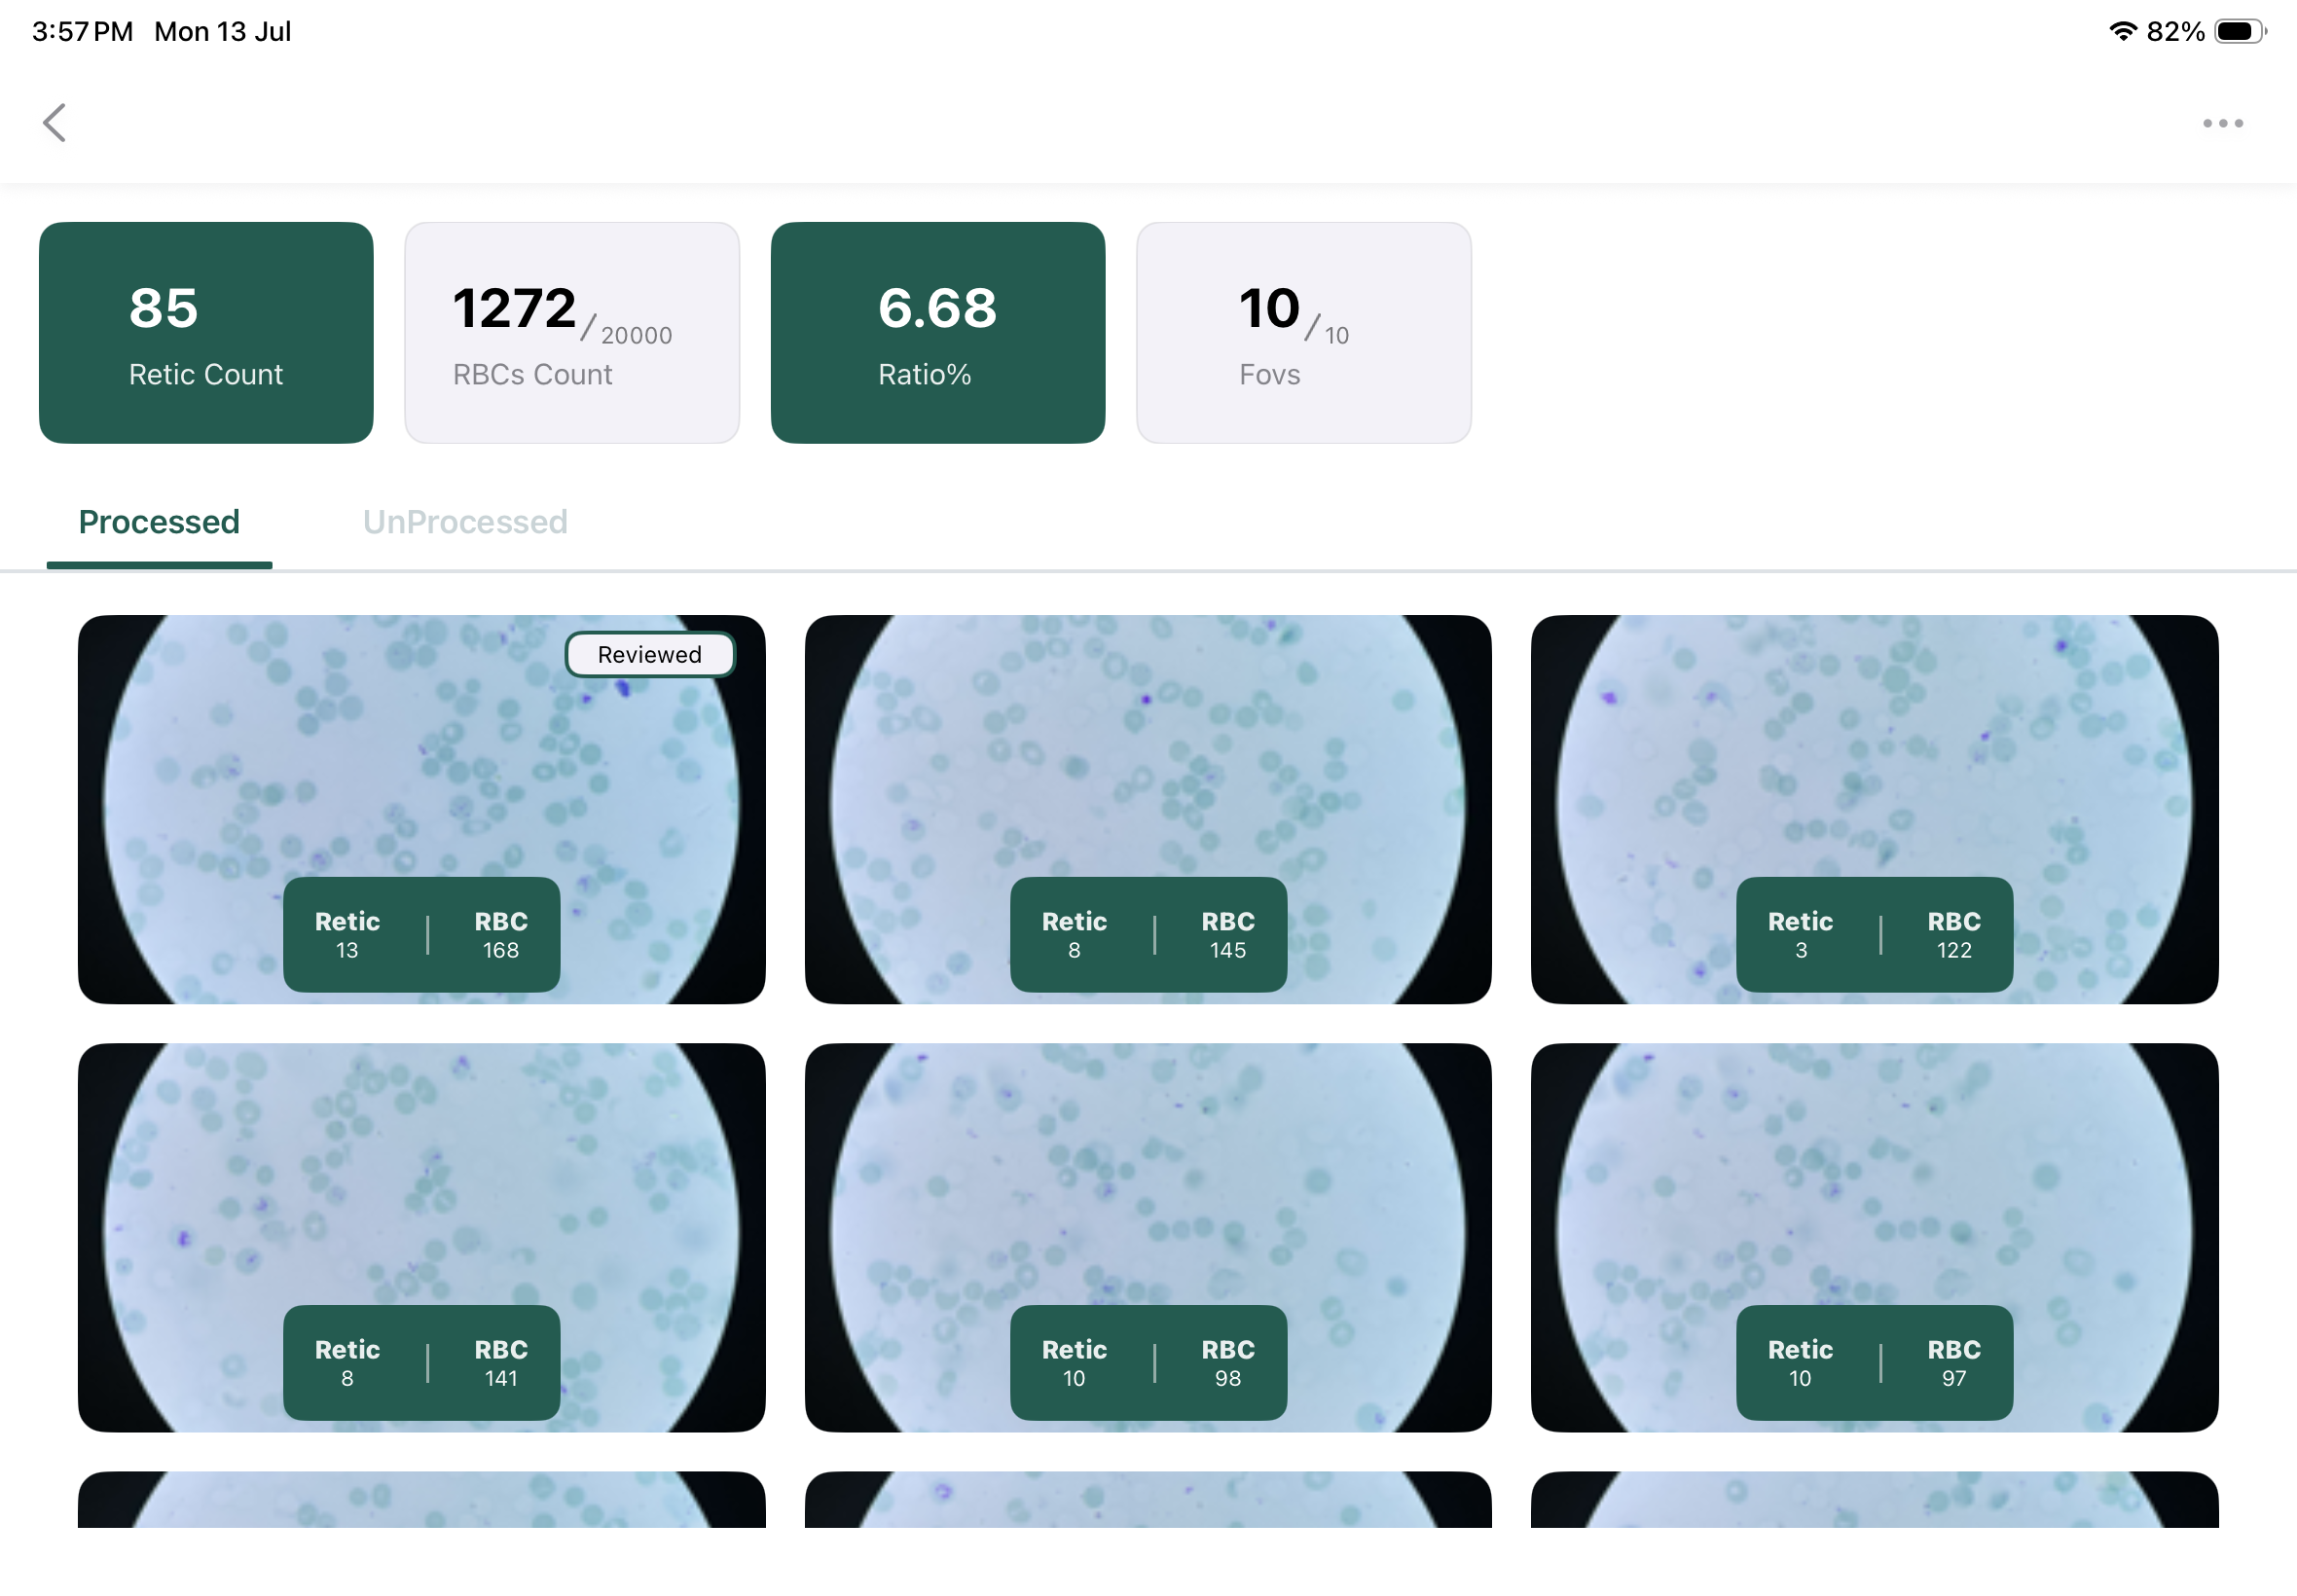
Once image capture is complete, the application processes the images and displays the analysis results.
|
Figure 6 |
|
7. Review AI Detection Results
Each processed image can be reviewed to verify the AI-generated detections before generating the final report.
-
Select a processed image from the image list.
-
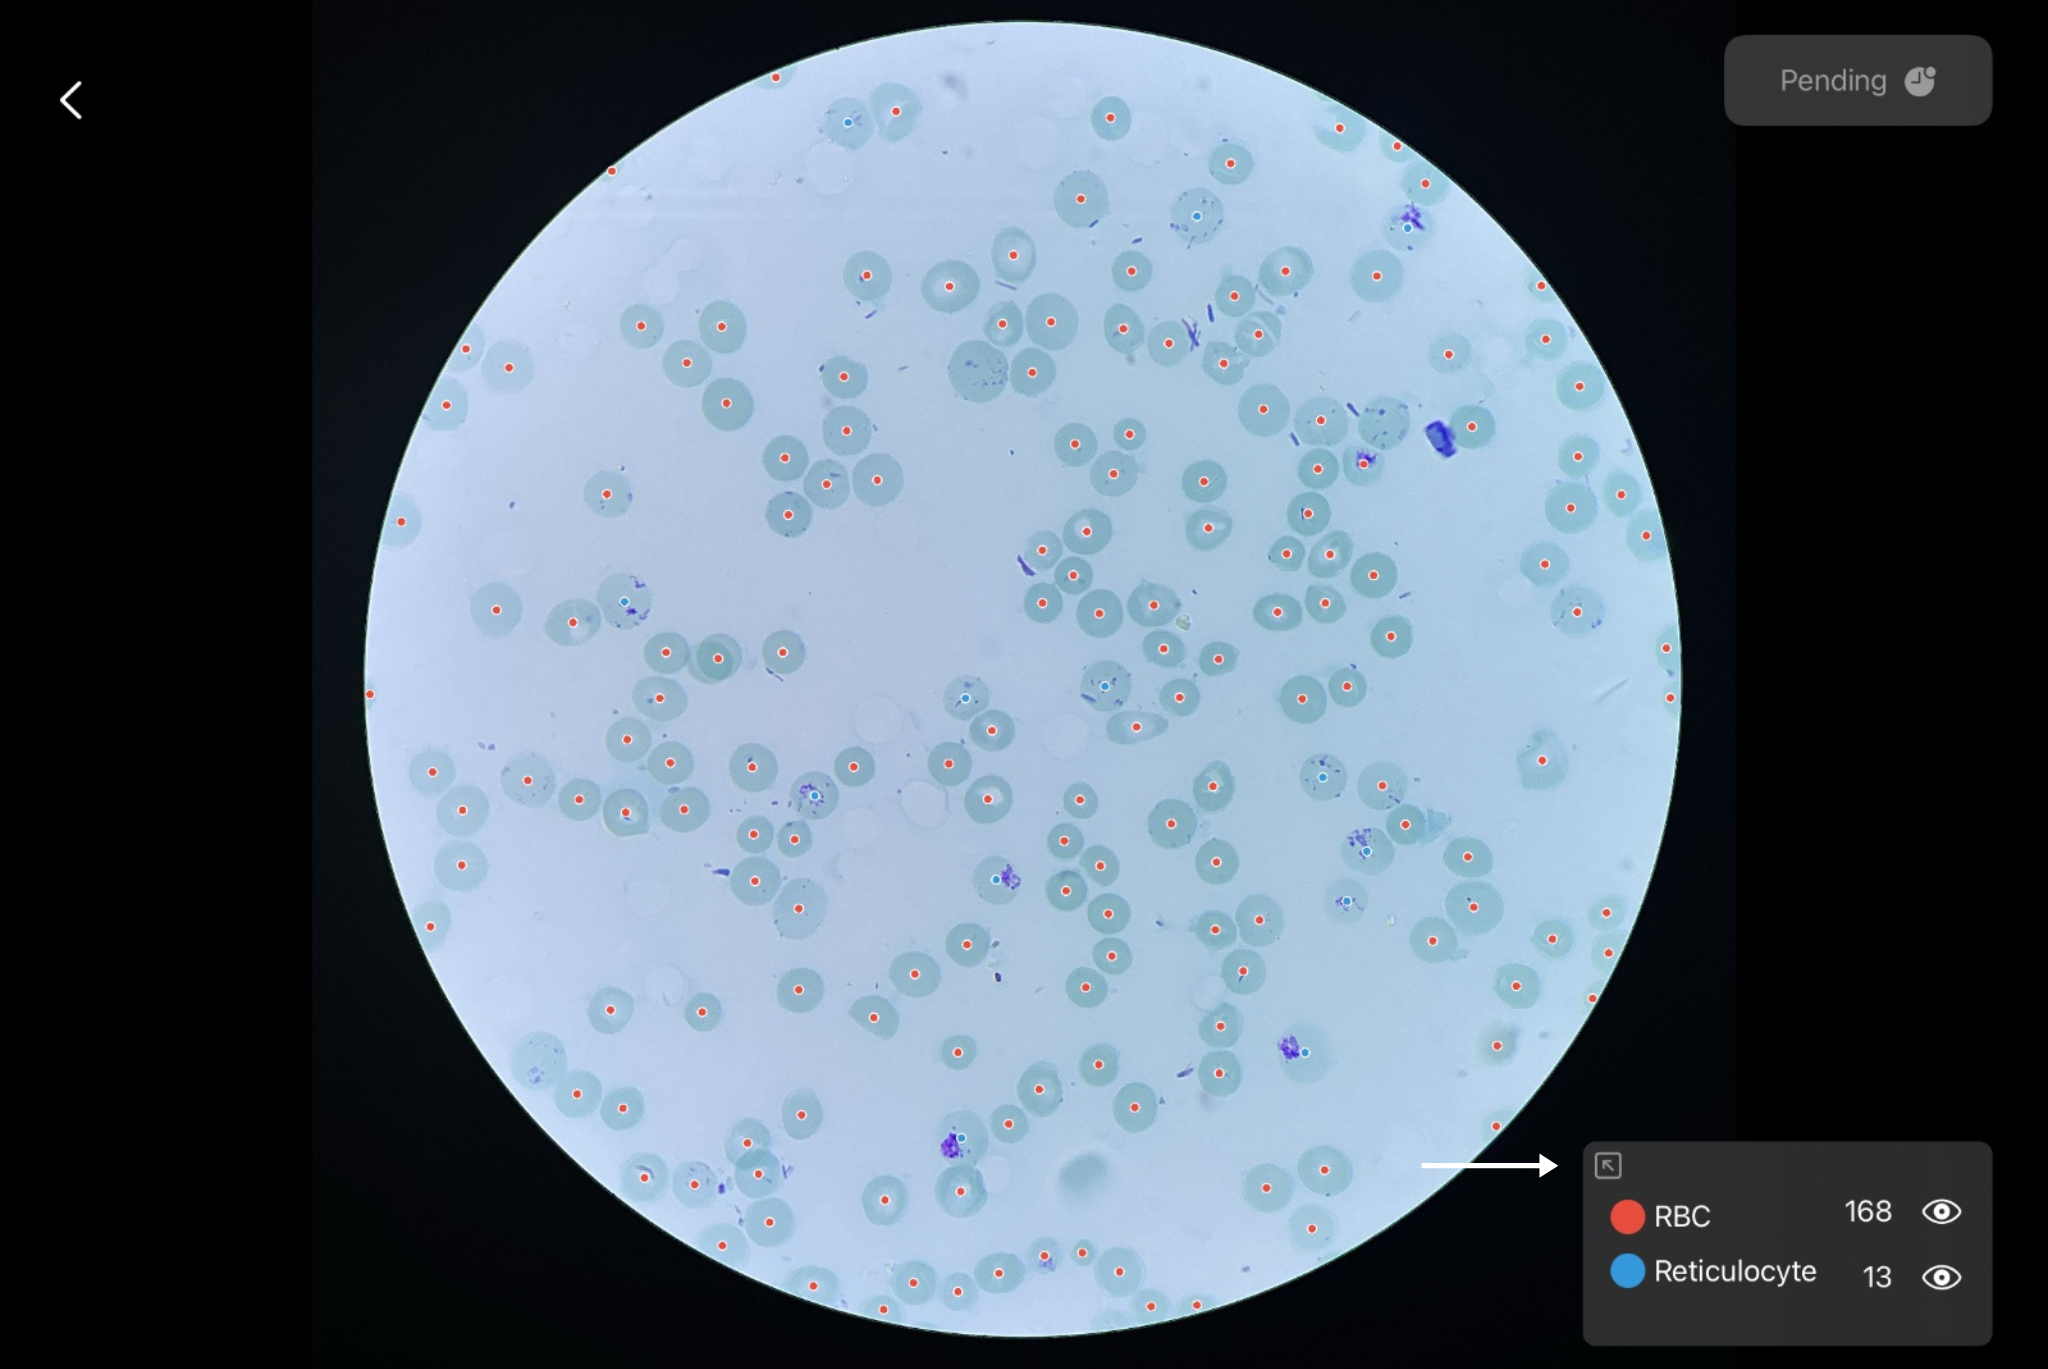
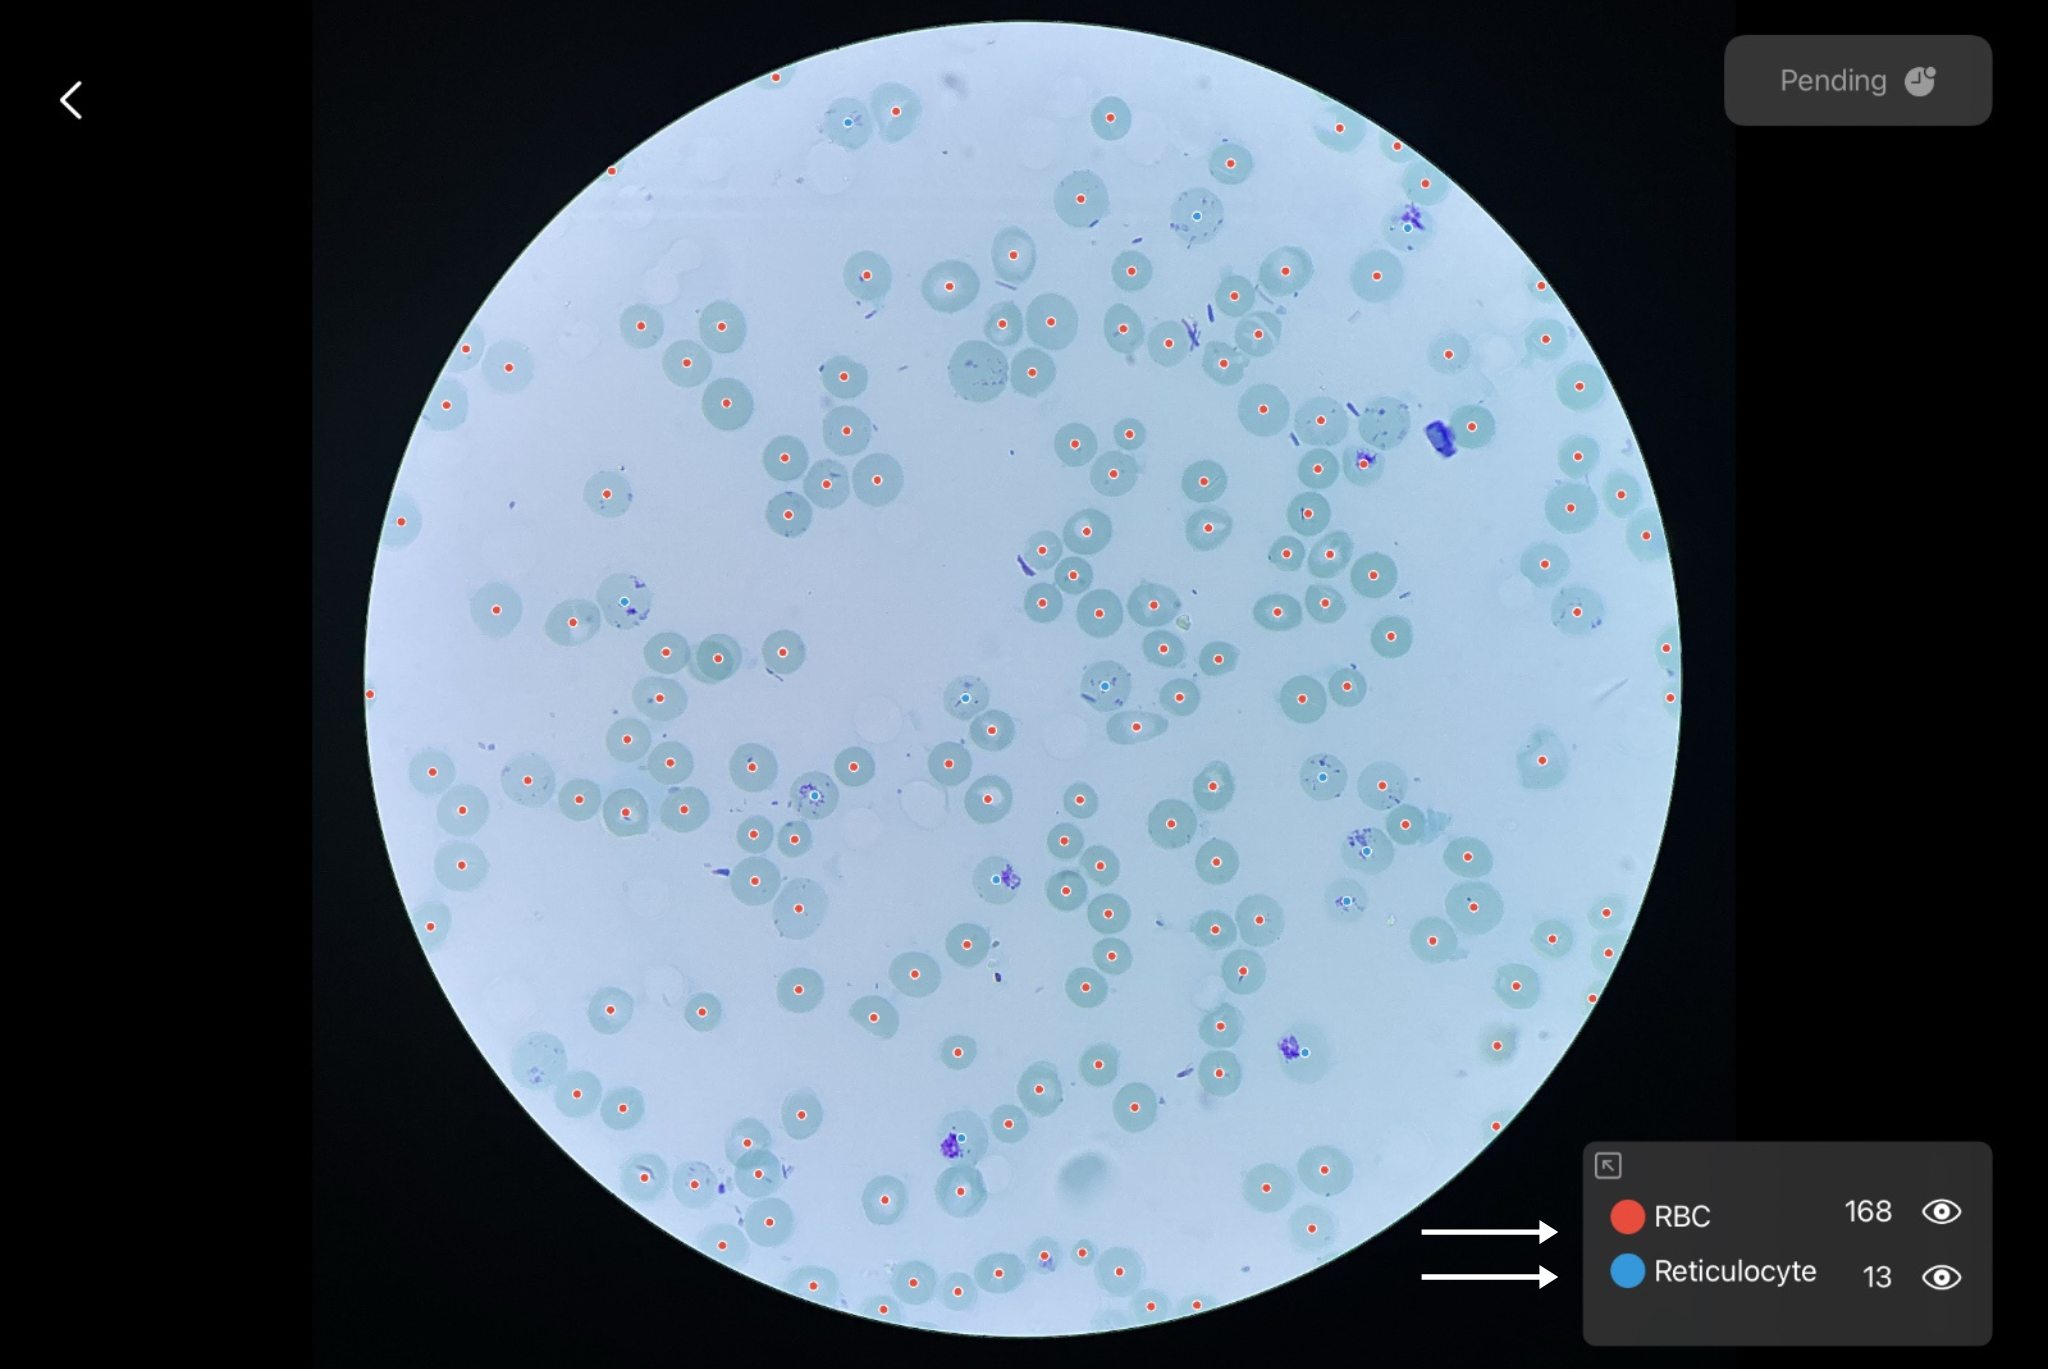
Review the highlighted AI detentions displayed on the microscope image.
-
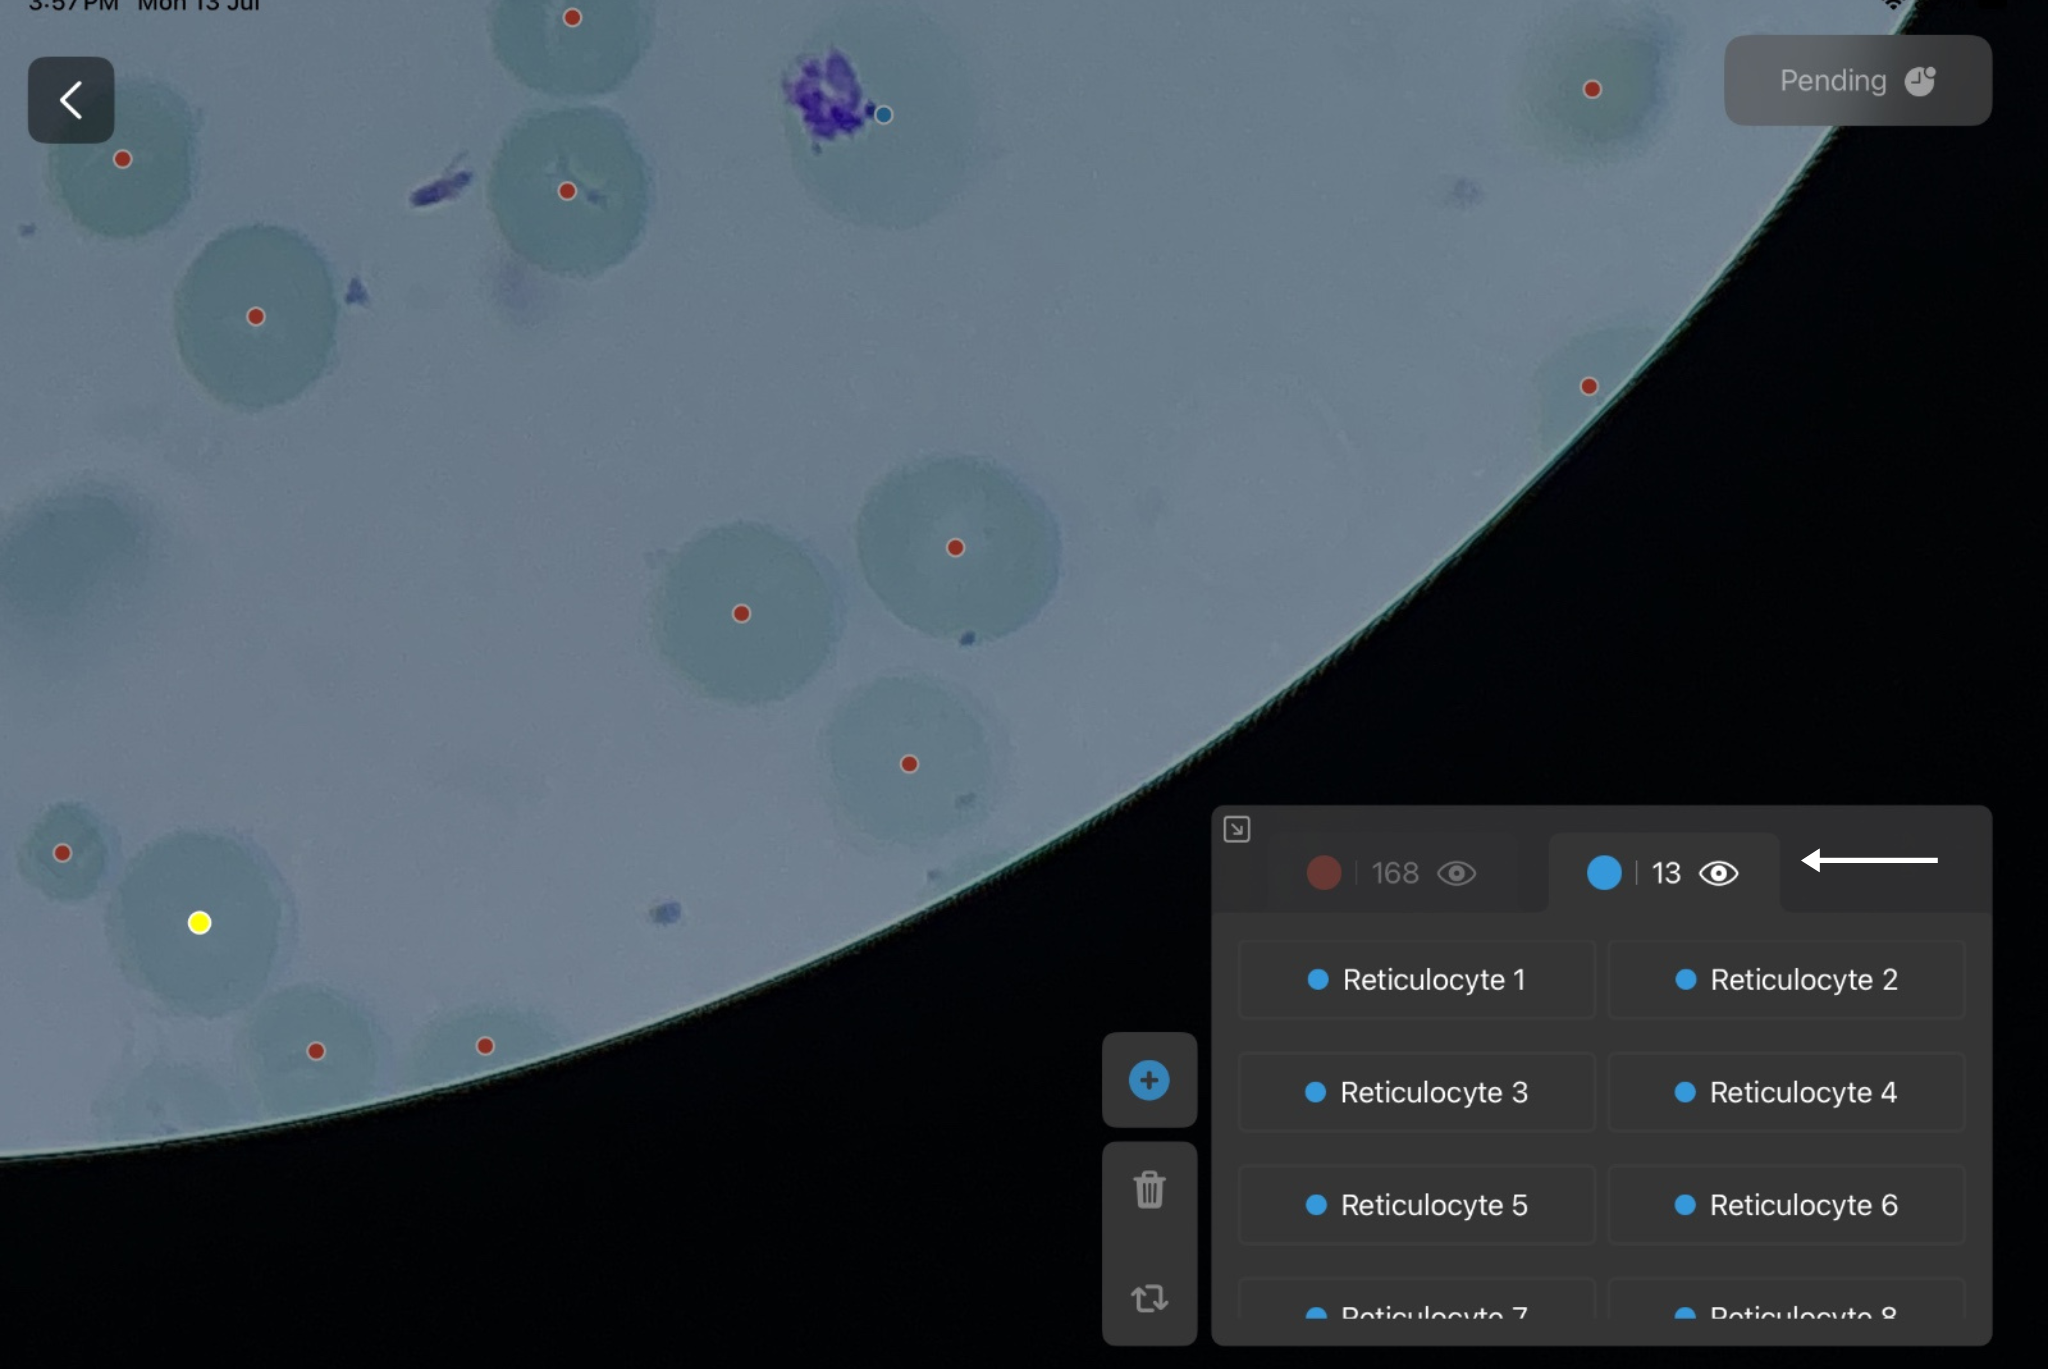
View the list of detected reticulocytes.
-
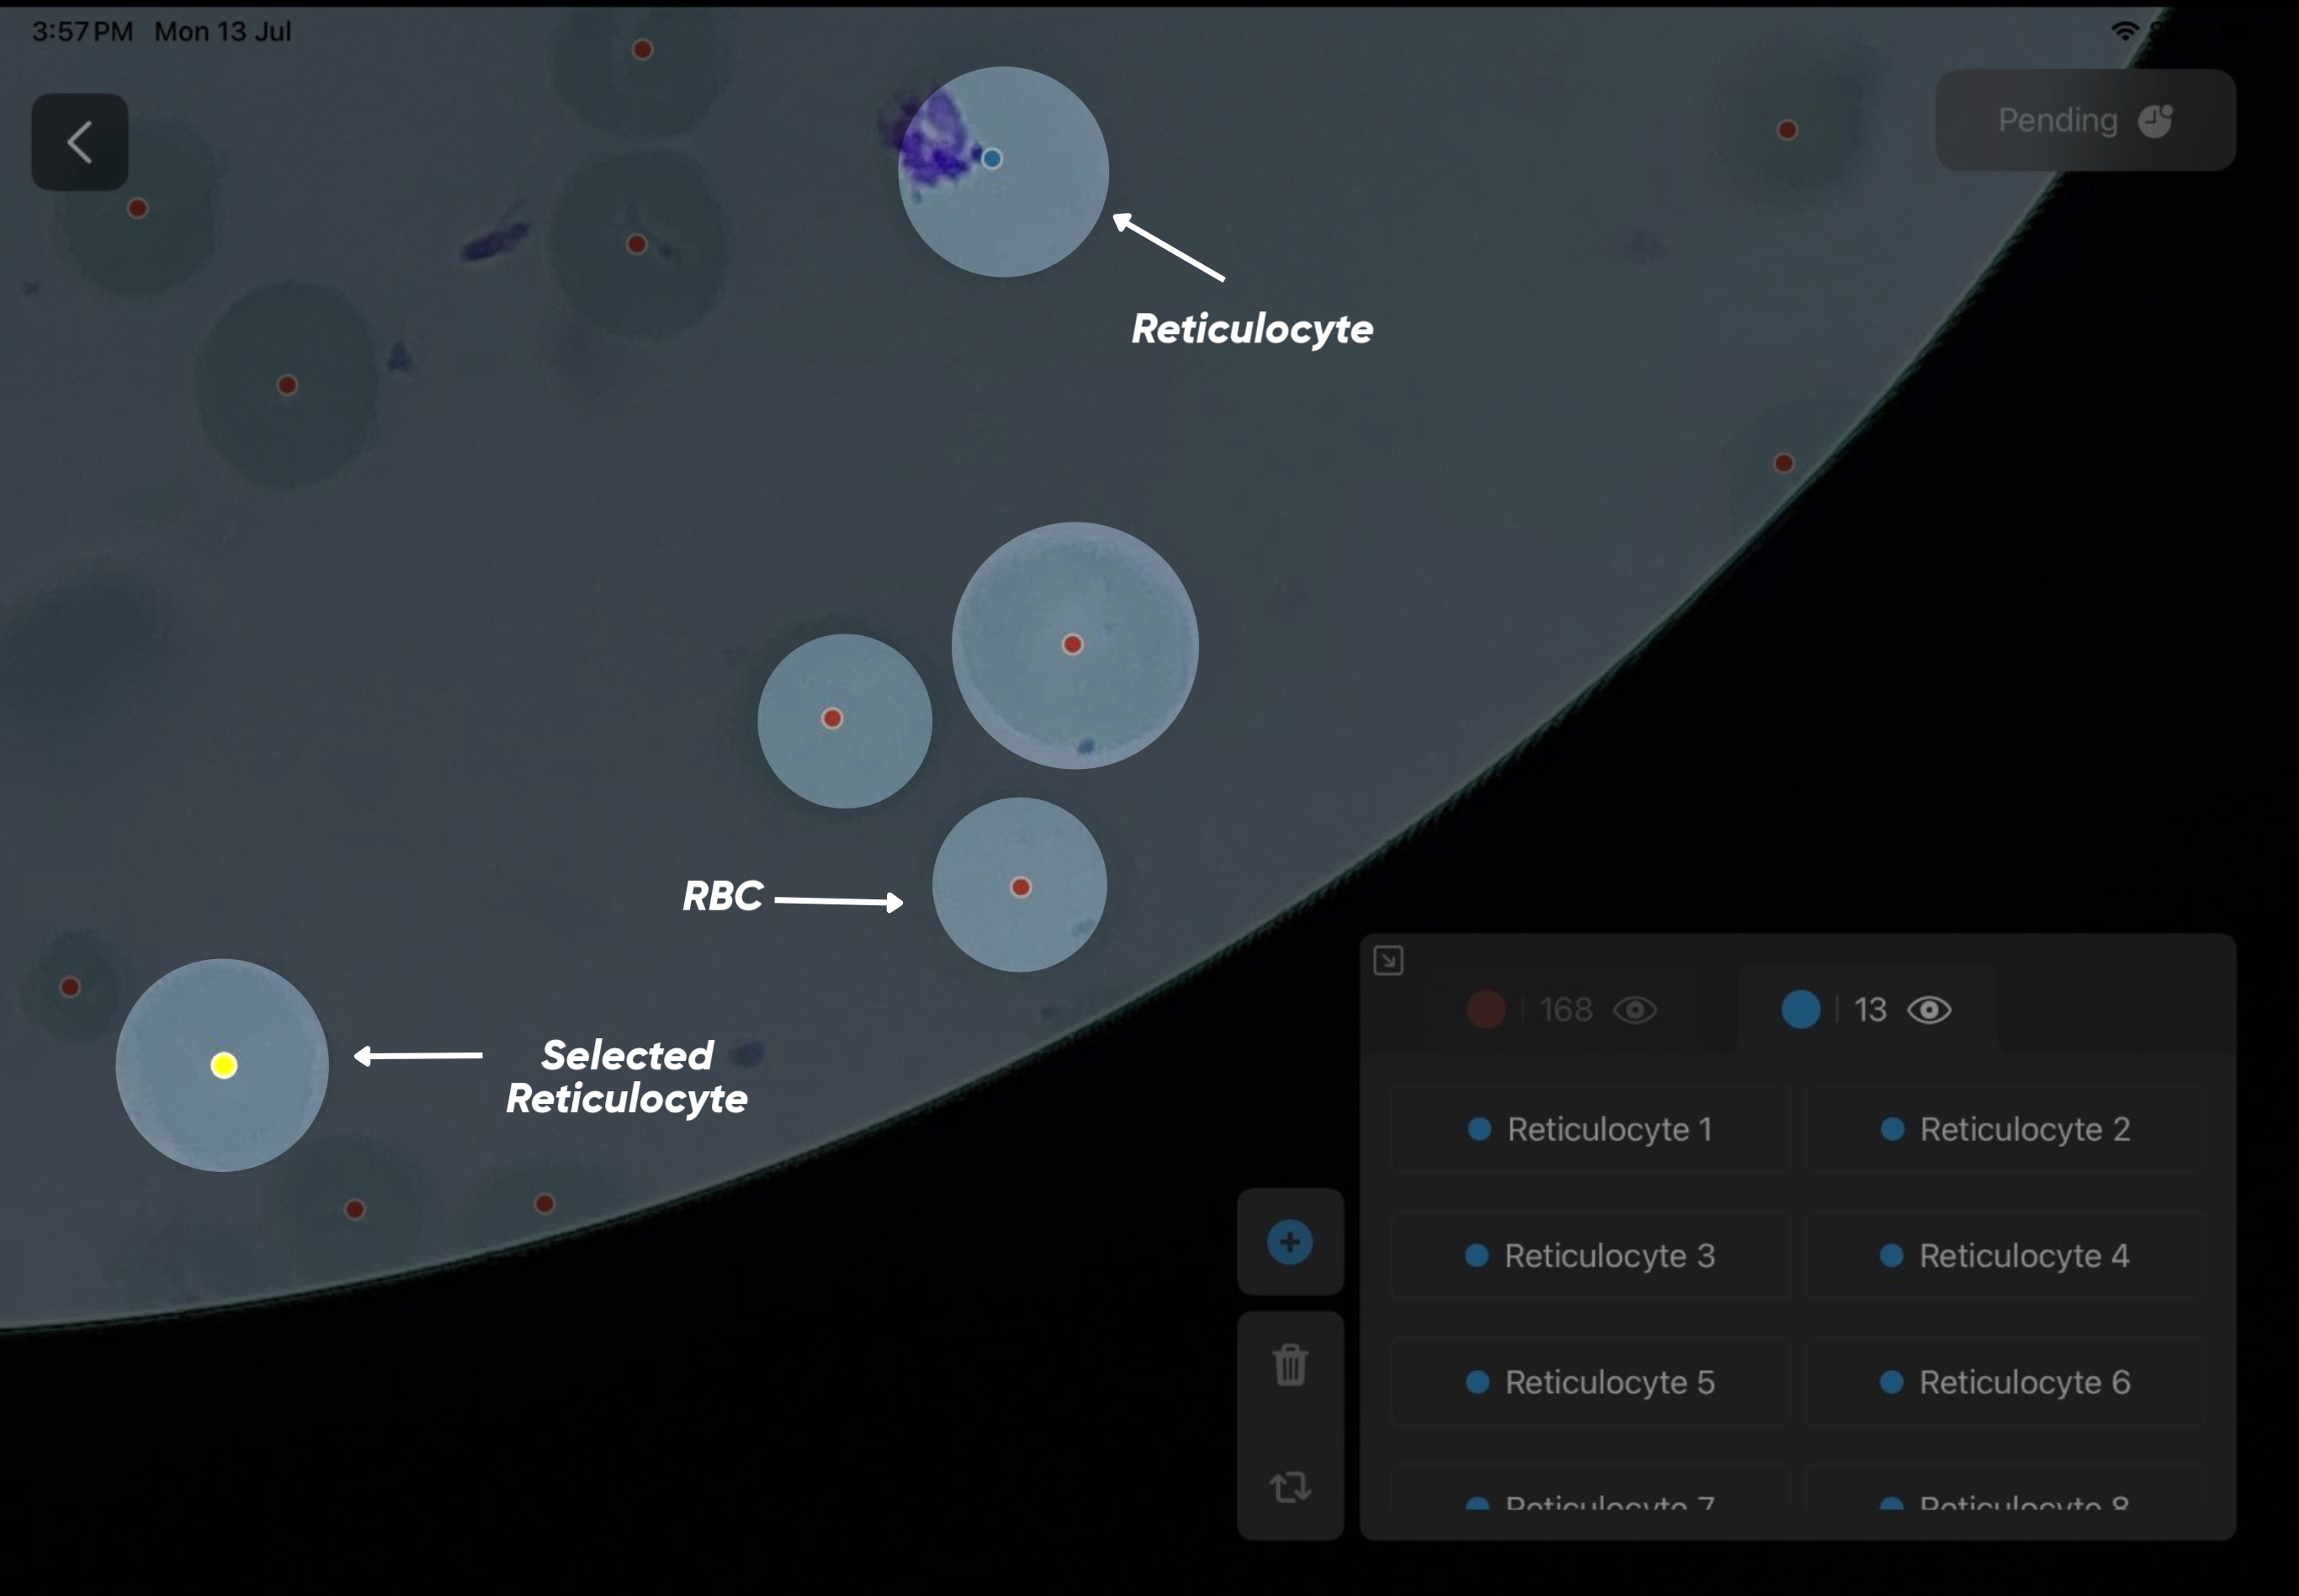
Select any detected reticulocyte to view its position within the image.
- All the cells are denoted by a certain color:
- RBC - Red
- Reticulocyte - Blue
- Selected Reticulocyte - Yellow
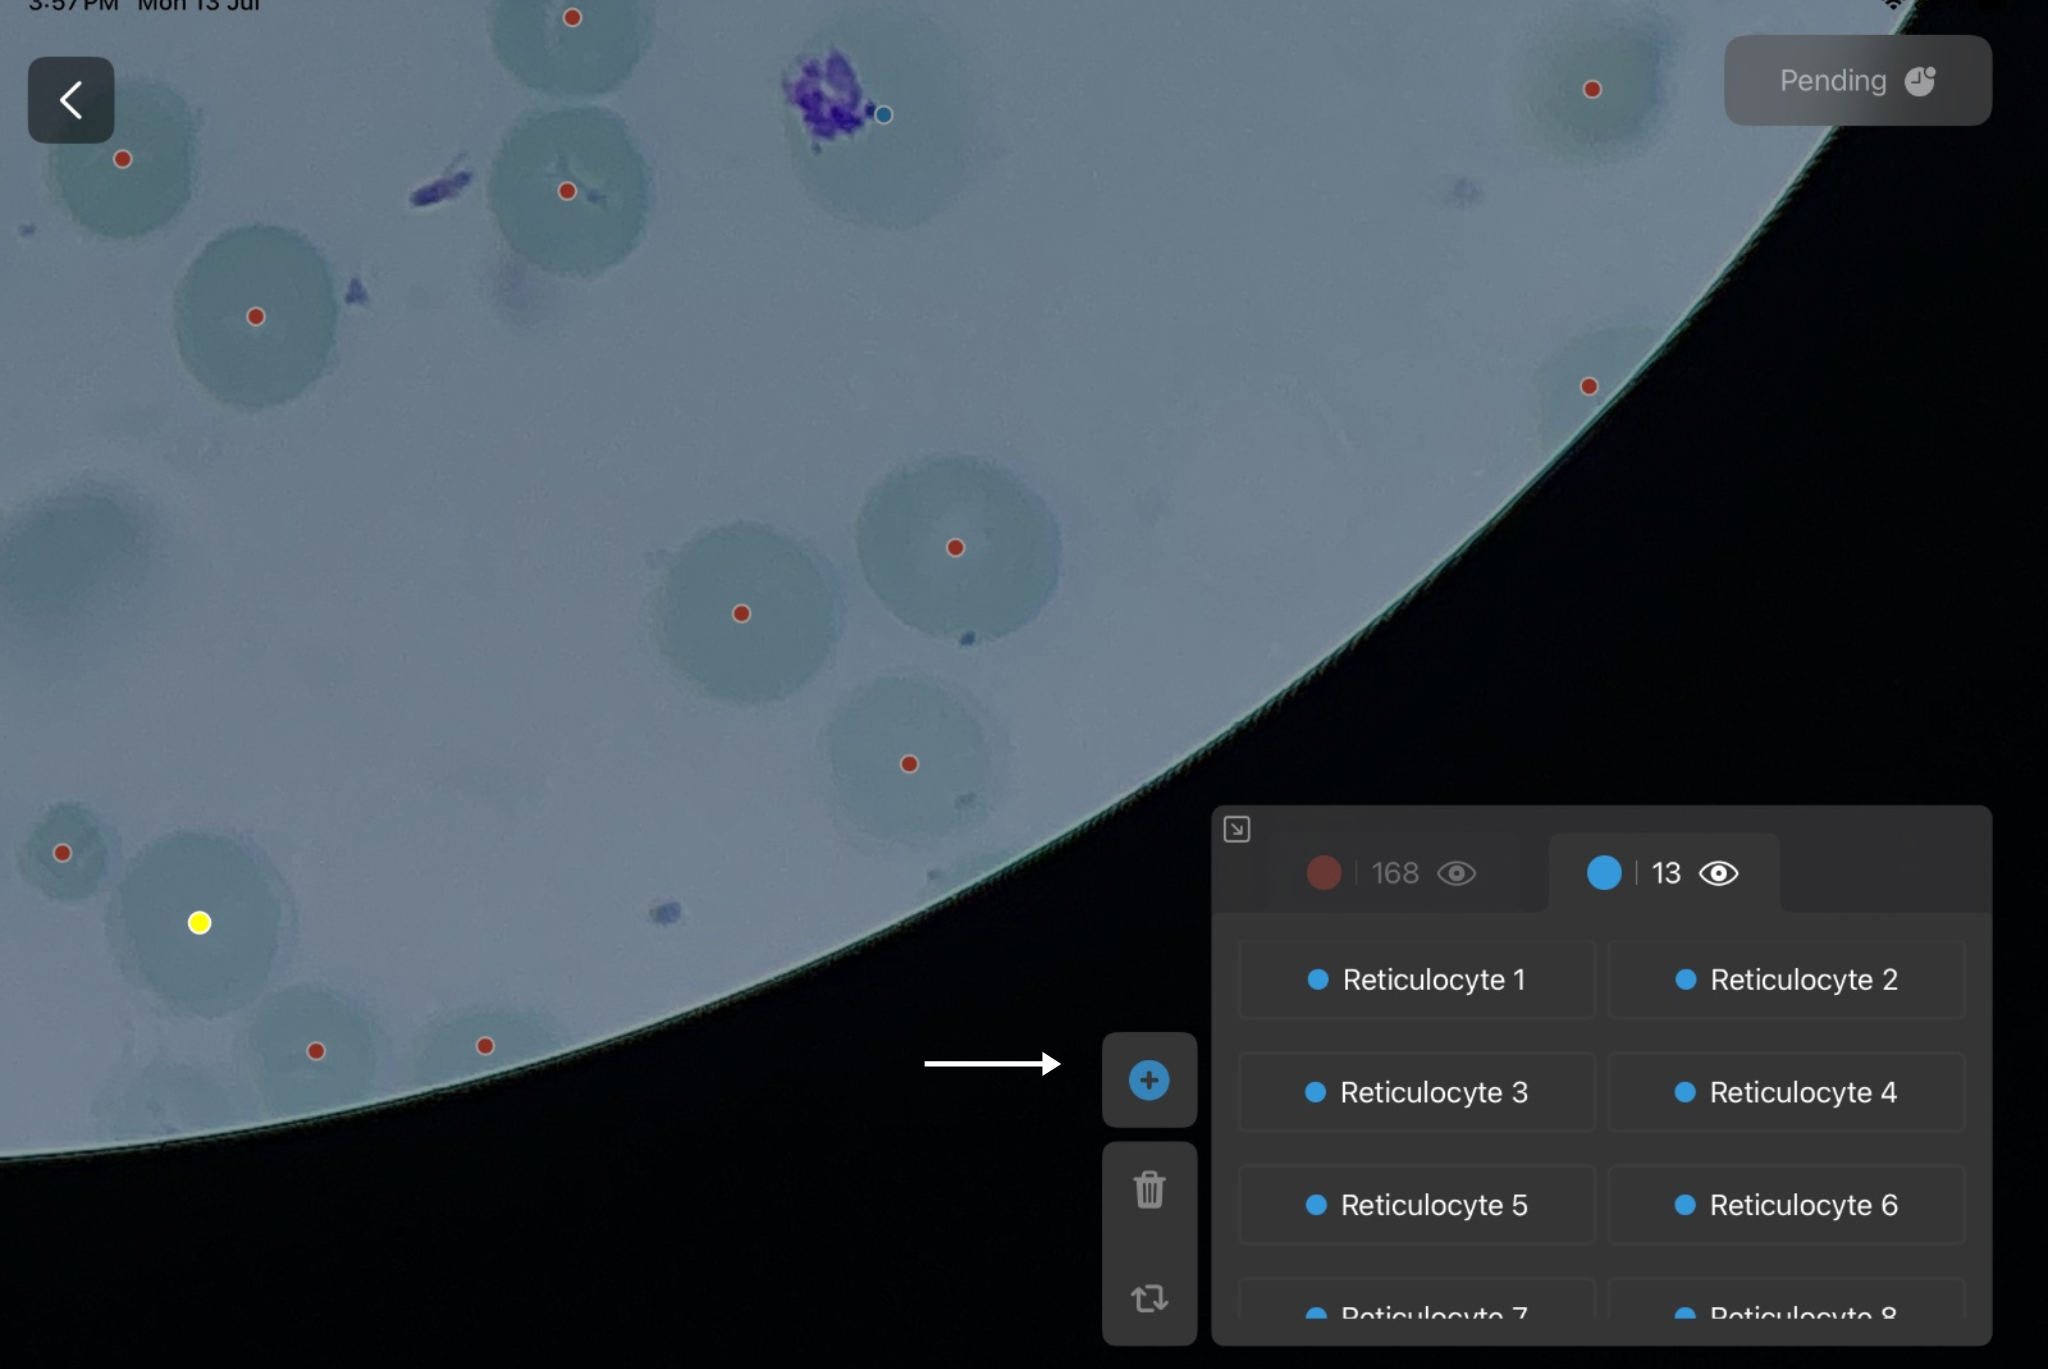
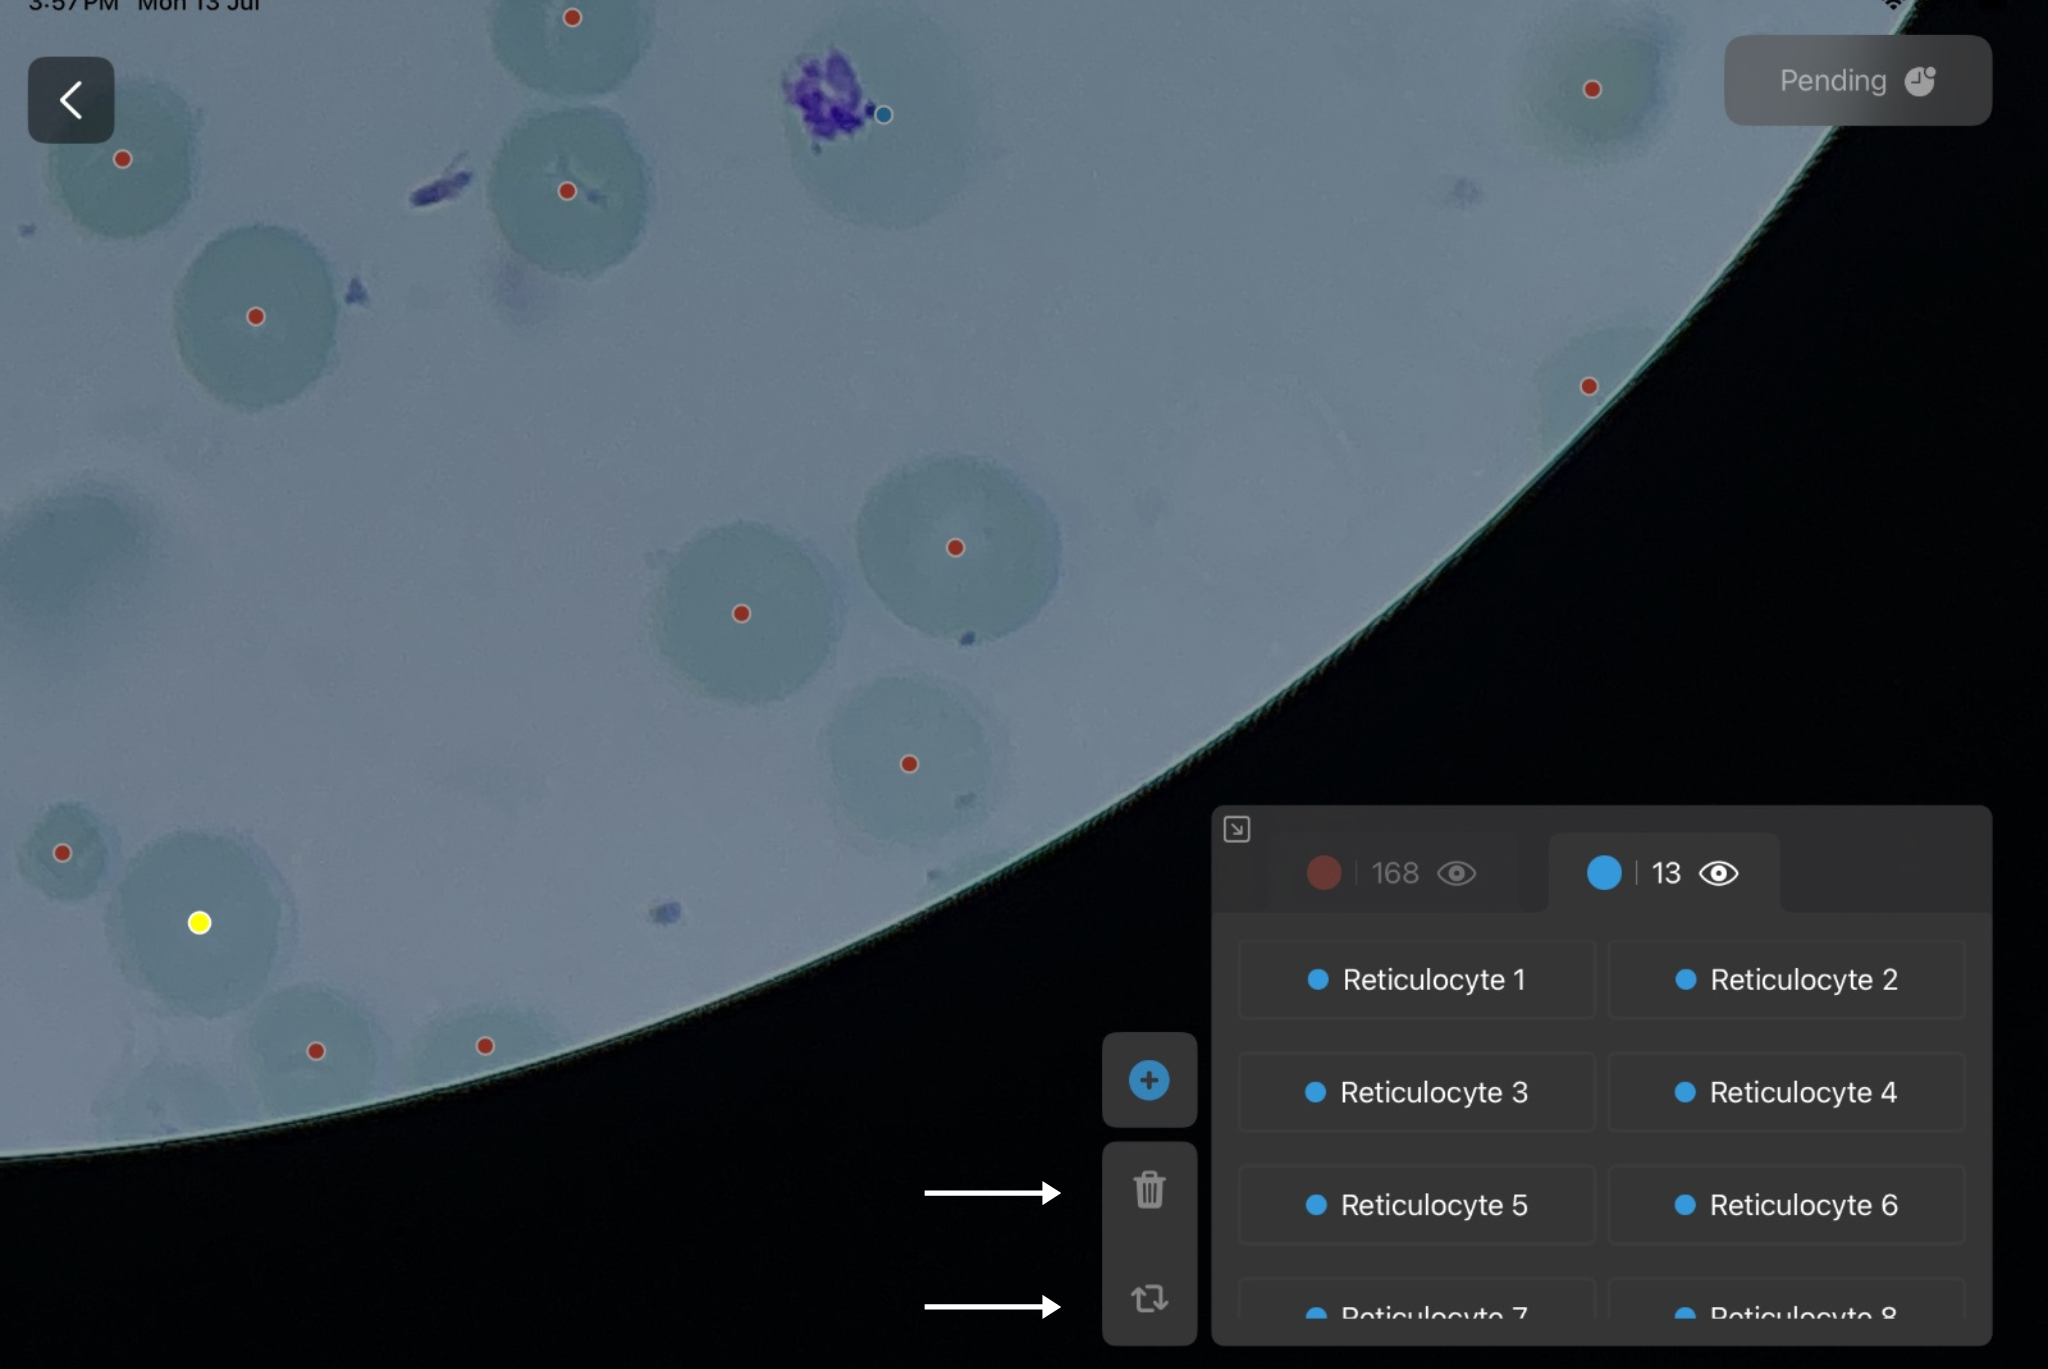
6. If required, manually:
-
Delete a detection.
-
Modify an existing detection.
7. Save the changes and return to the processed image list.
|
Figure 7 |
|
|
Figure 7.2 |
|
|
Figure 7.4 |
|
8. Reviewed Images
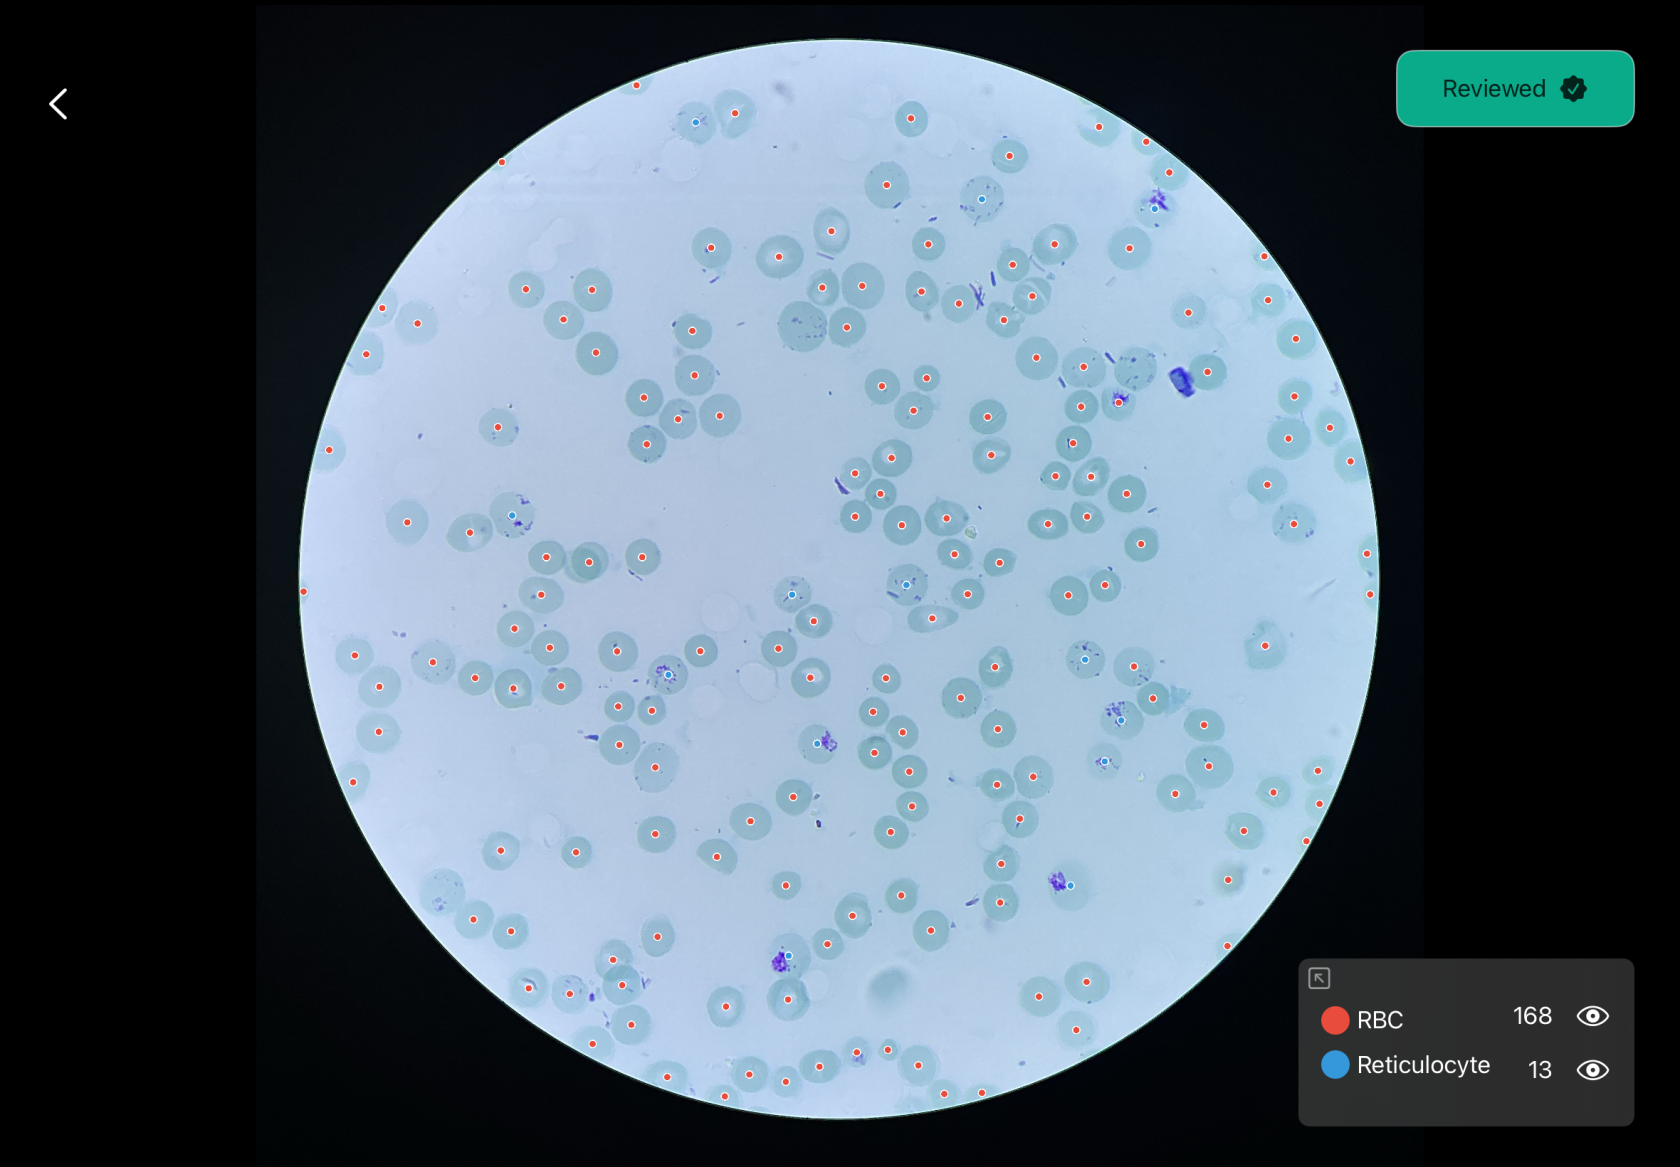
Images that have been reviewed can be marked to help you identify completed reviews.
-
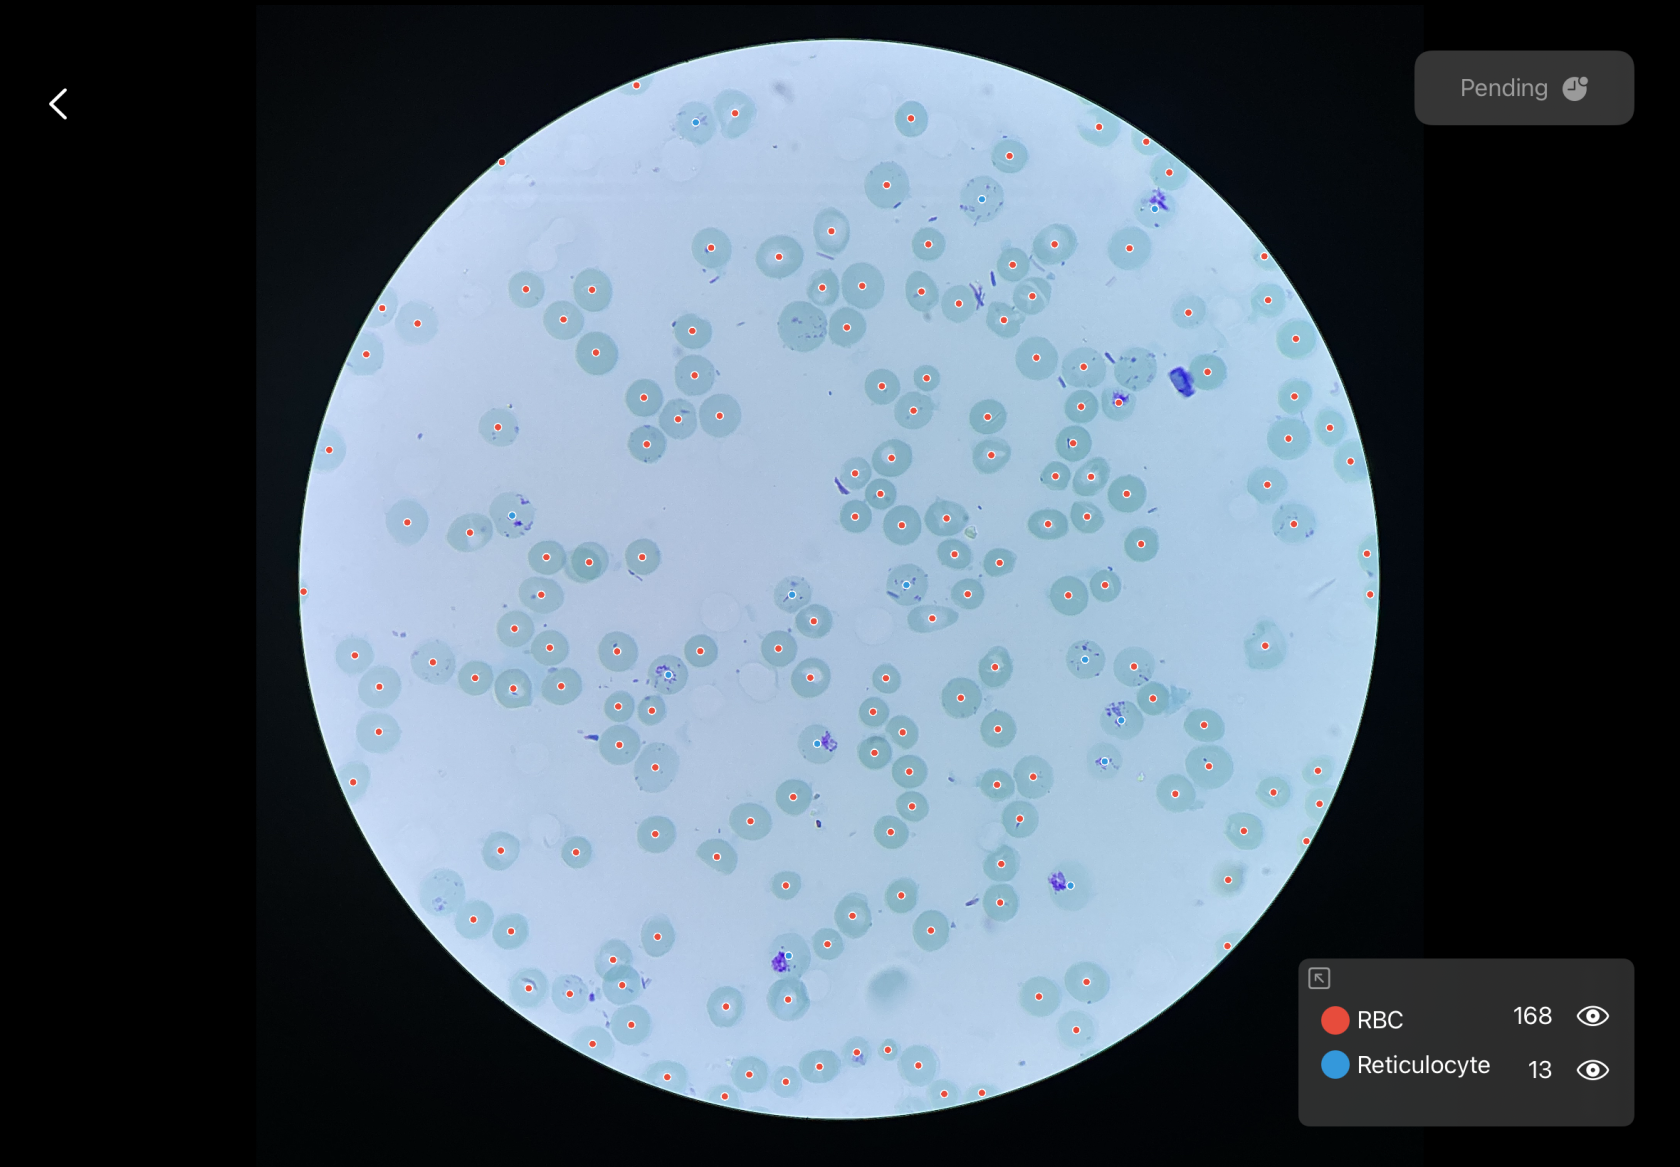
Complete the review of a processed image by tapping on the Pending button.
- The Pending button is located a the top right.
-
Return to the Processed tab.
-
Locate the reviewed image.
-
Verify that the image displays the Reviewed badge.
|
Figure 8 |
Figure 8.1 |
|
Figure 8.2 |
|
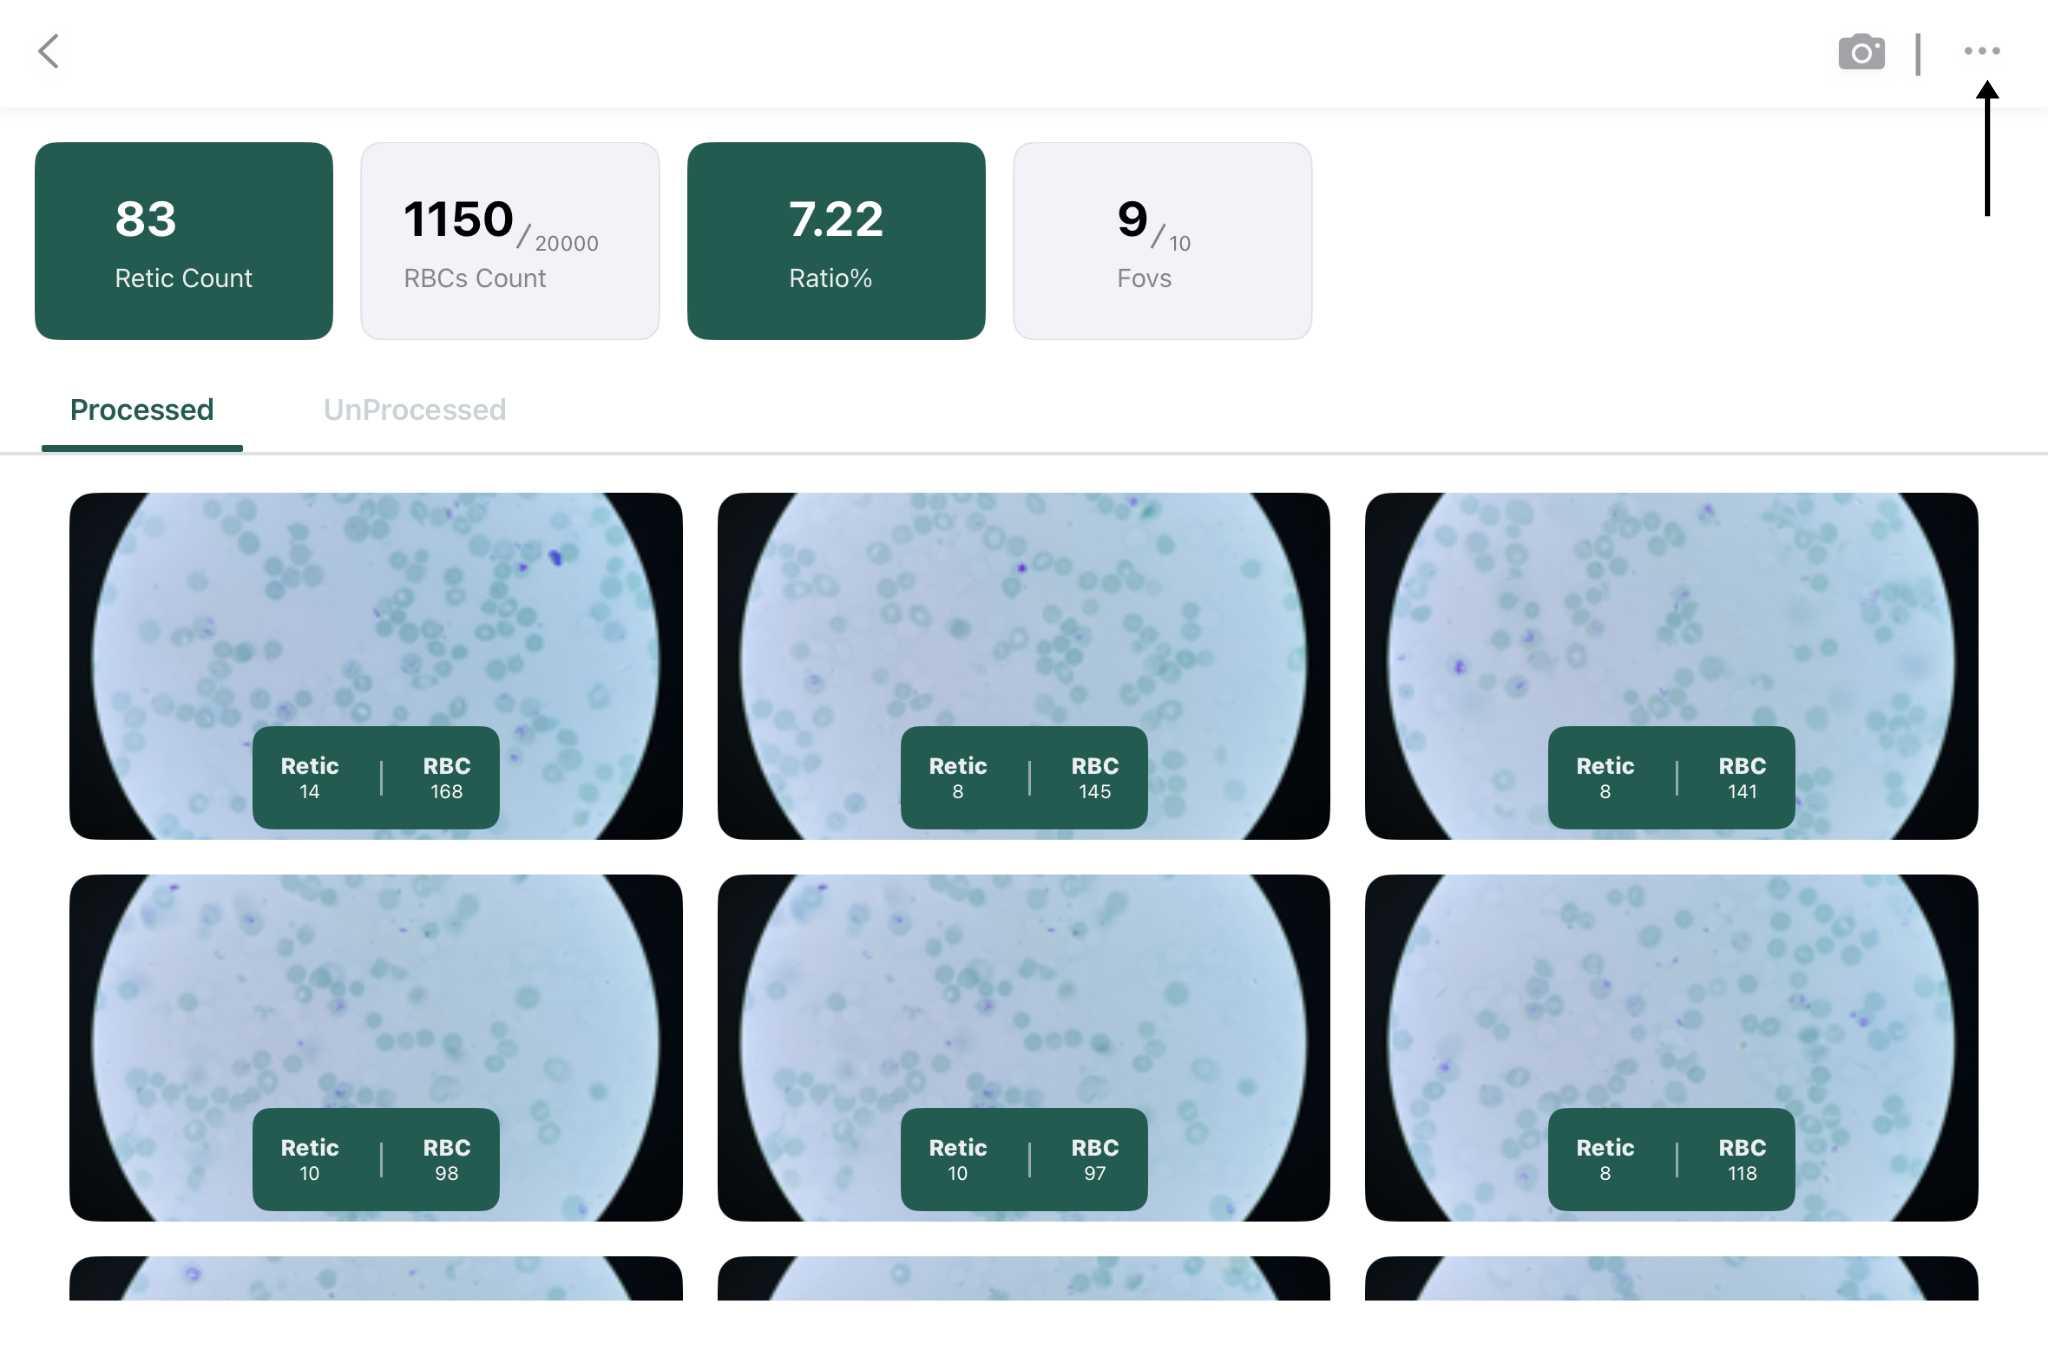
9(A). Generate a Report
After reviewing all processed images, you can generate a patient report.
-
Open the completed case.
-
Click the More Options (⋮) menu.
-
Select Generate Report.
-
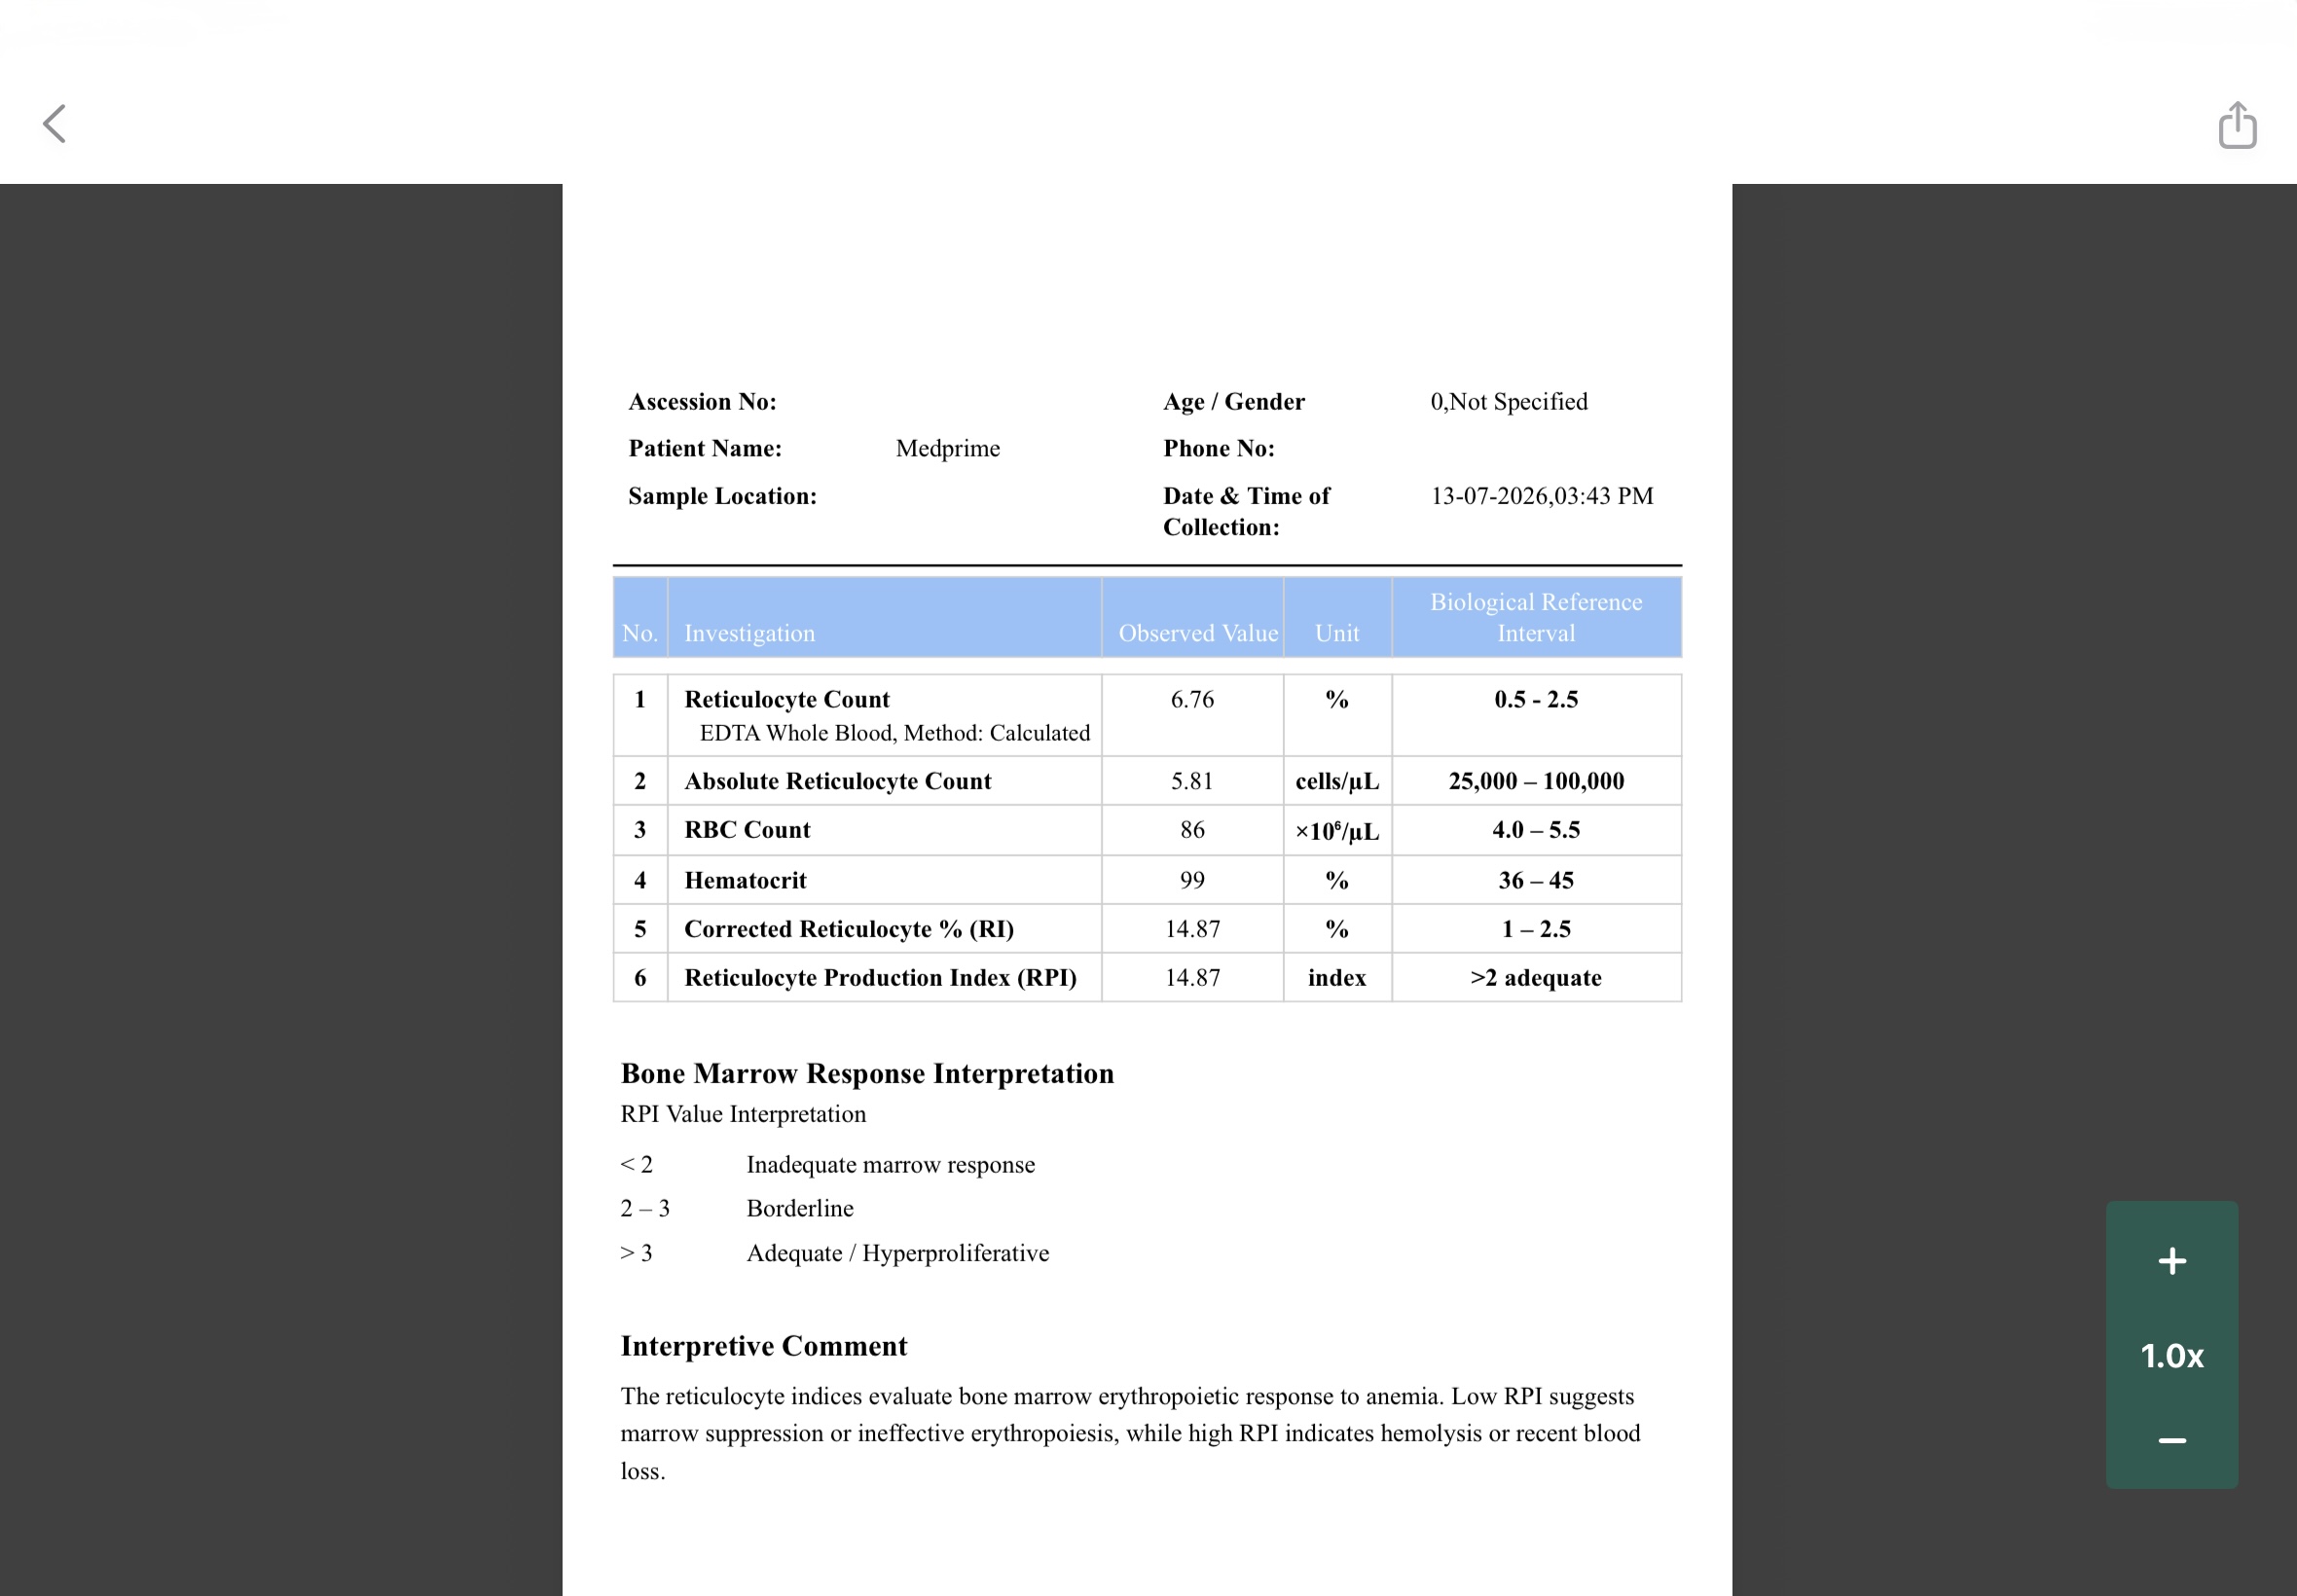
Review the generated report.
-
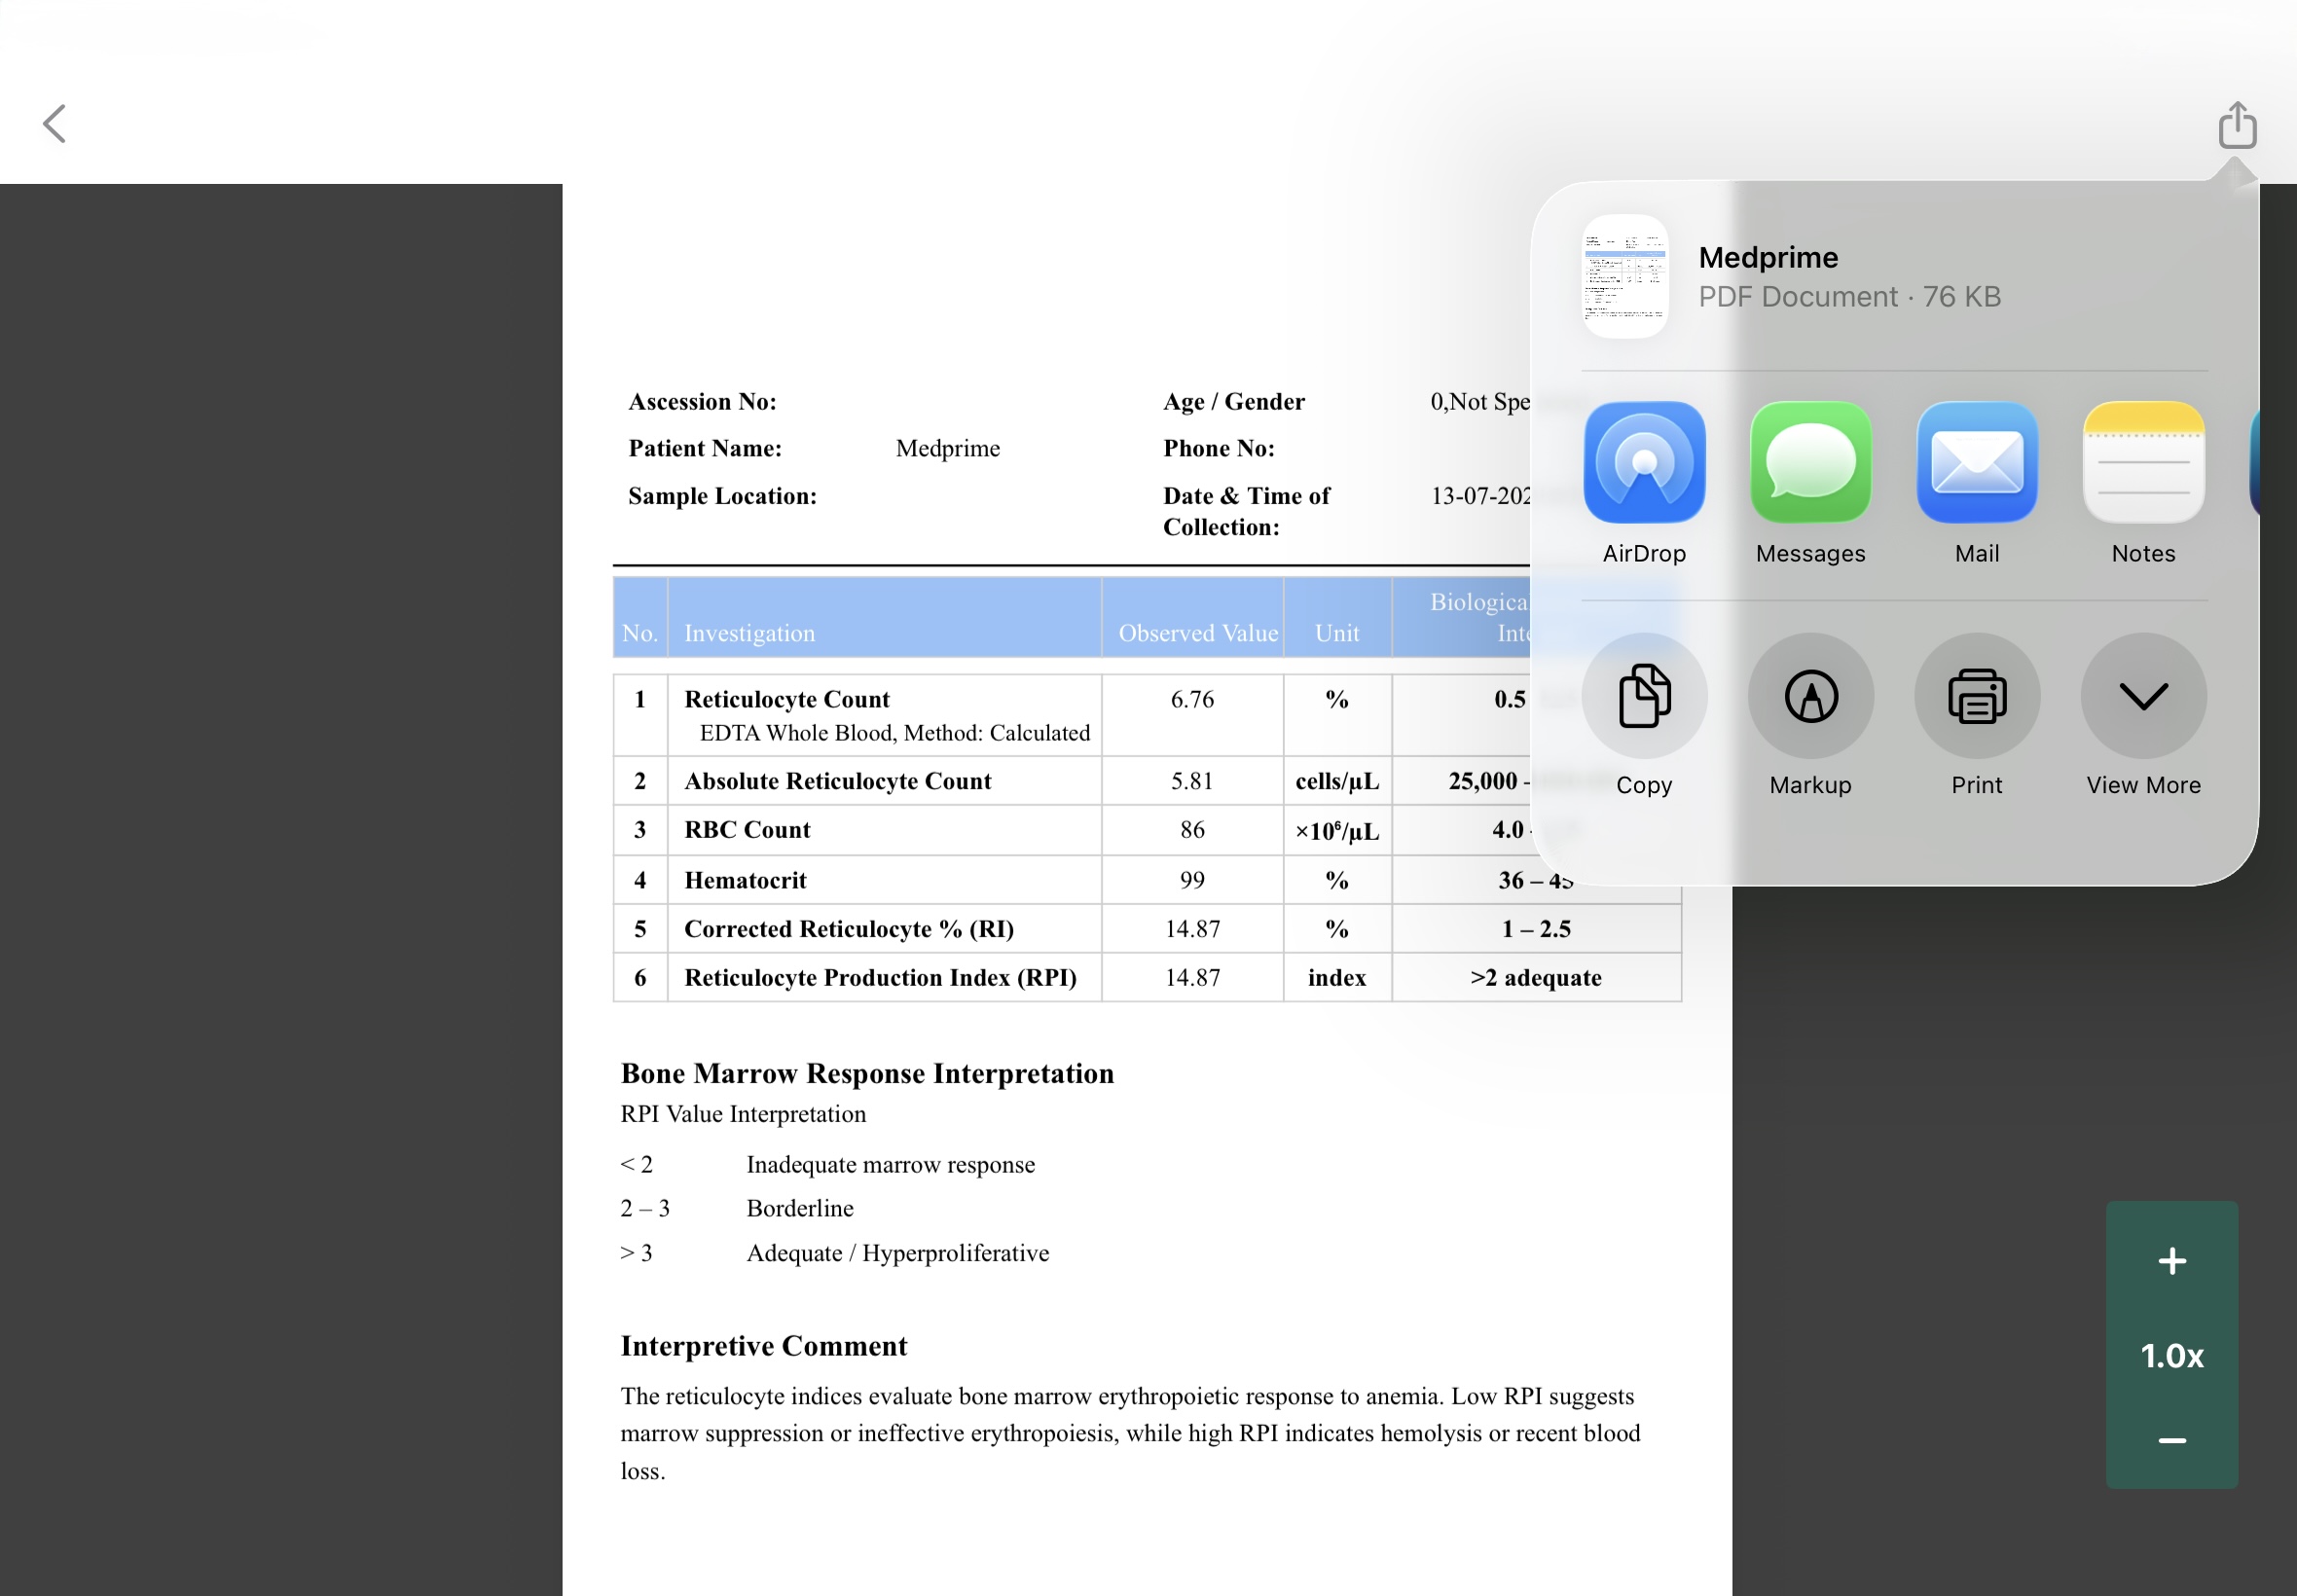
Save or share the report as required.
| Generate a Report | |
|
Figure 9 |
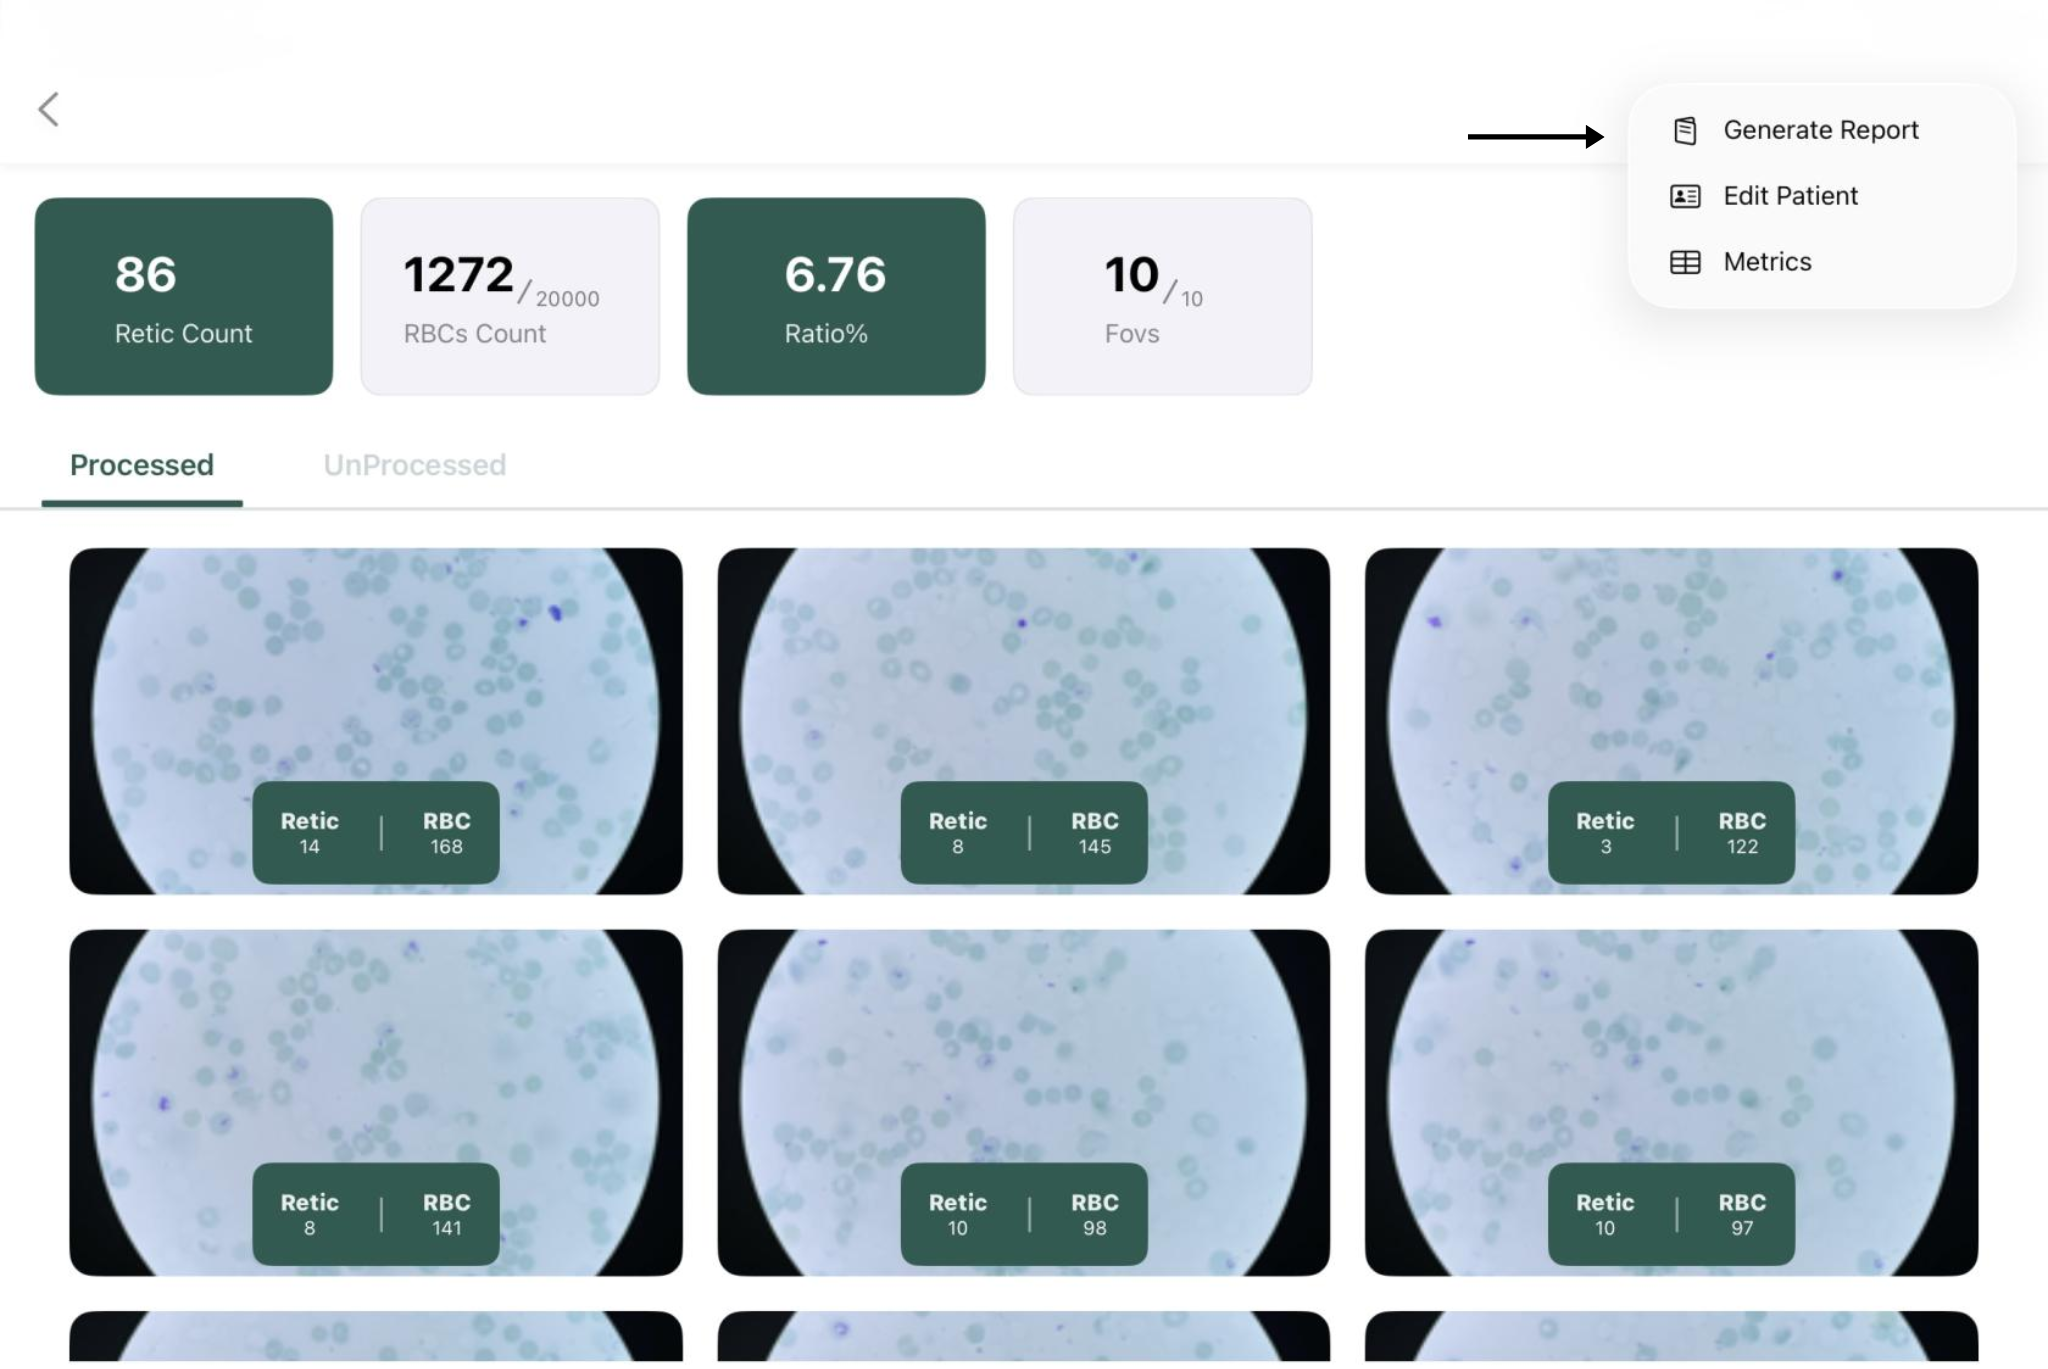 Figure 9.1 Figure 9.1 |
|
Figure 9.2 |
|
9(B). Edit Patient Information
Patient details can be updated at any time before generating the final report.
-
Open the required patient case.
-
Click the More Options (⋮) menu.
-
Select Edit Patient.
-
Update the required patient information.
-
Save the changes by tapping on Update
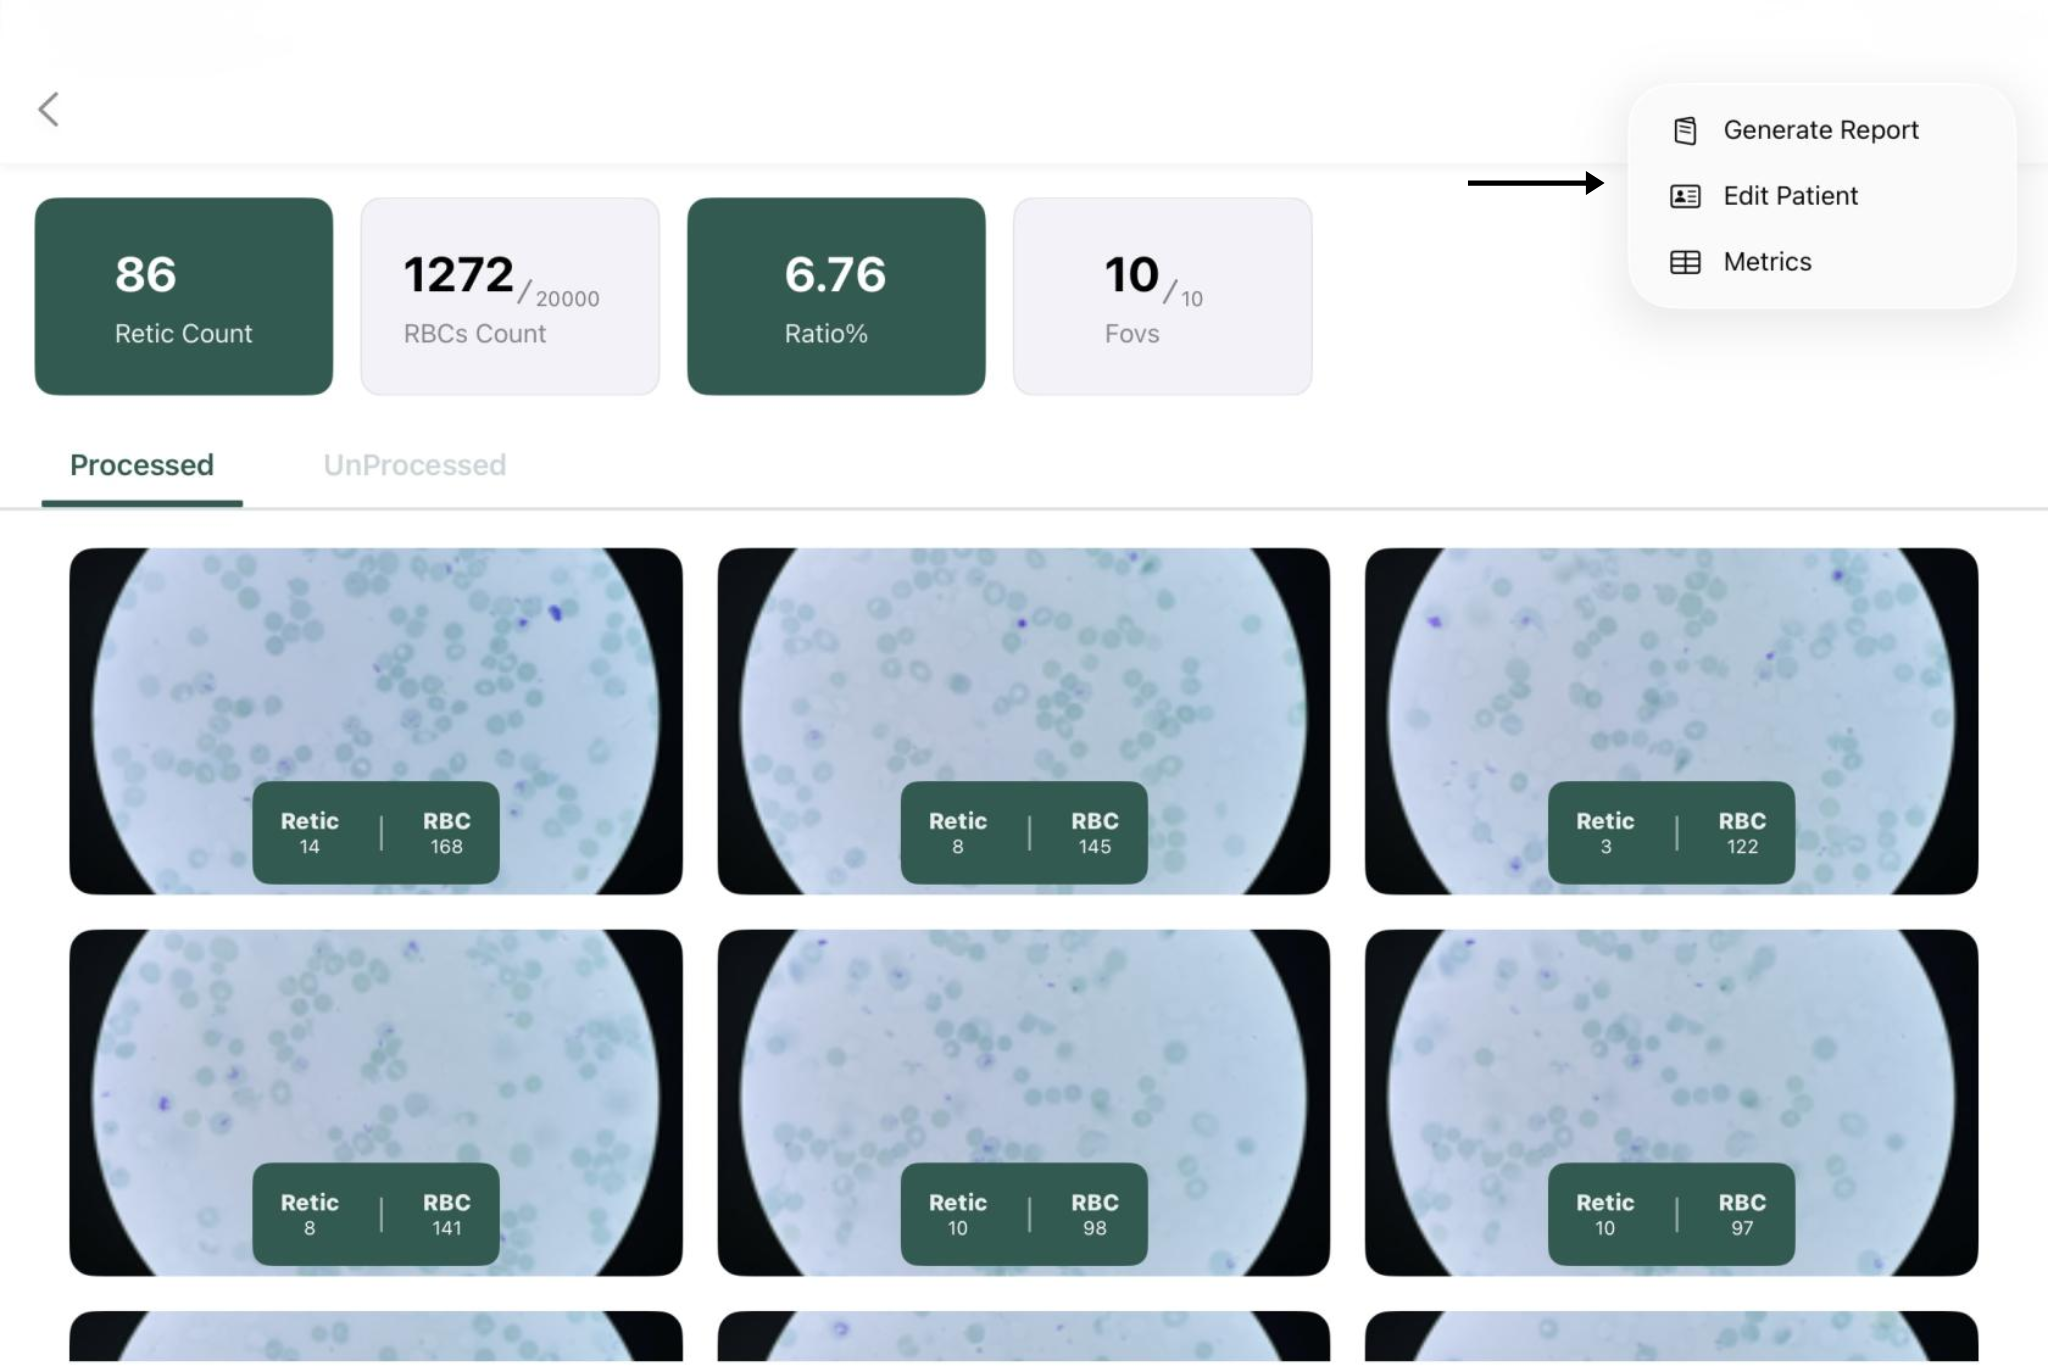
Figure 9(B)
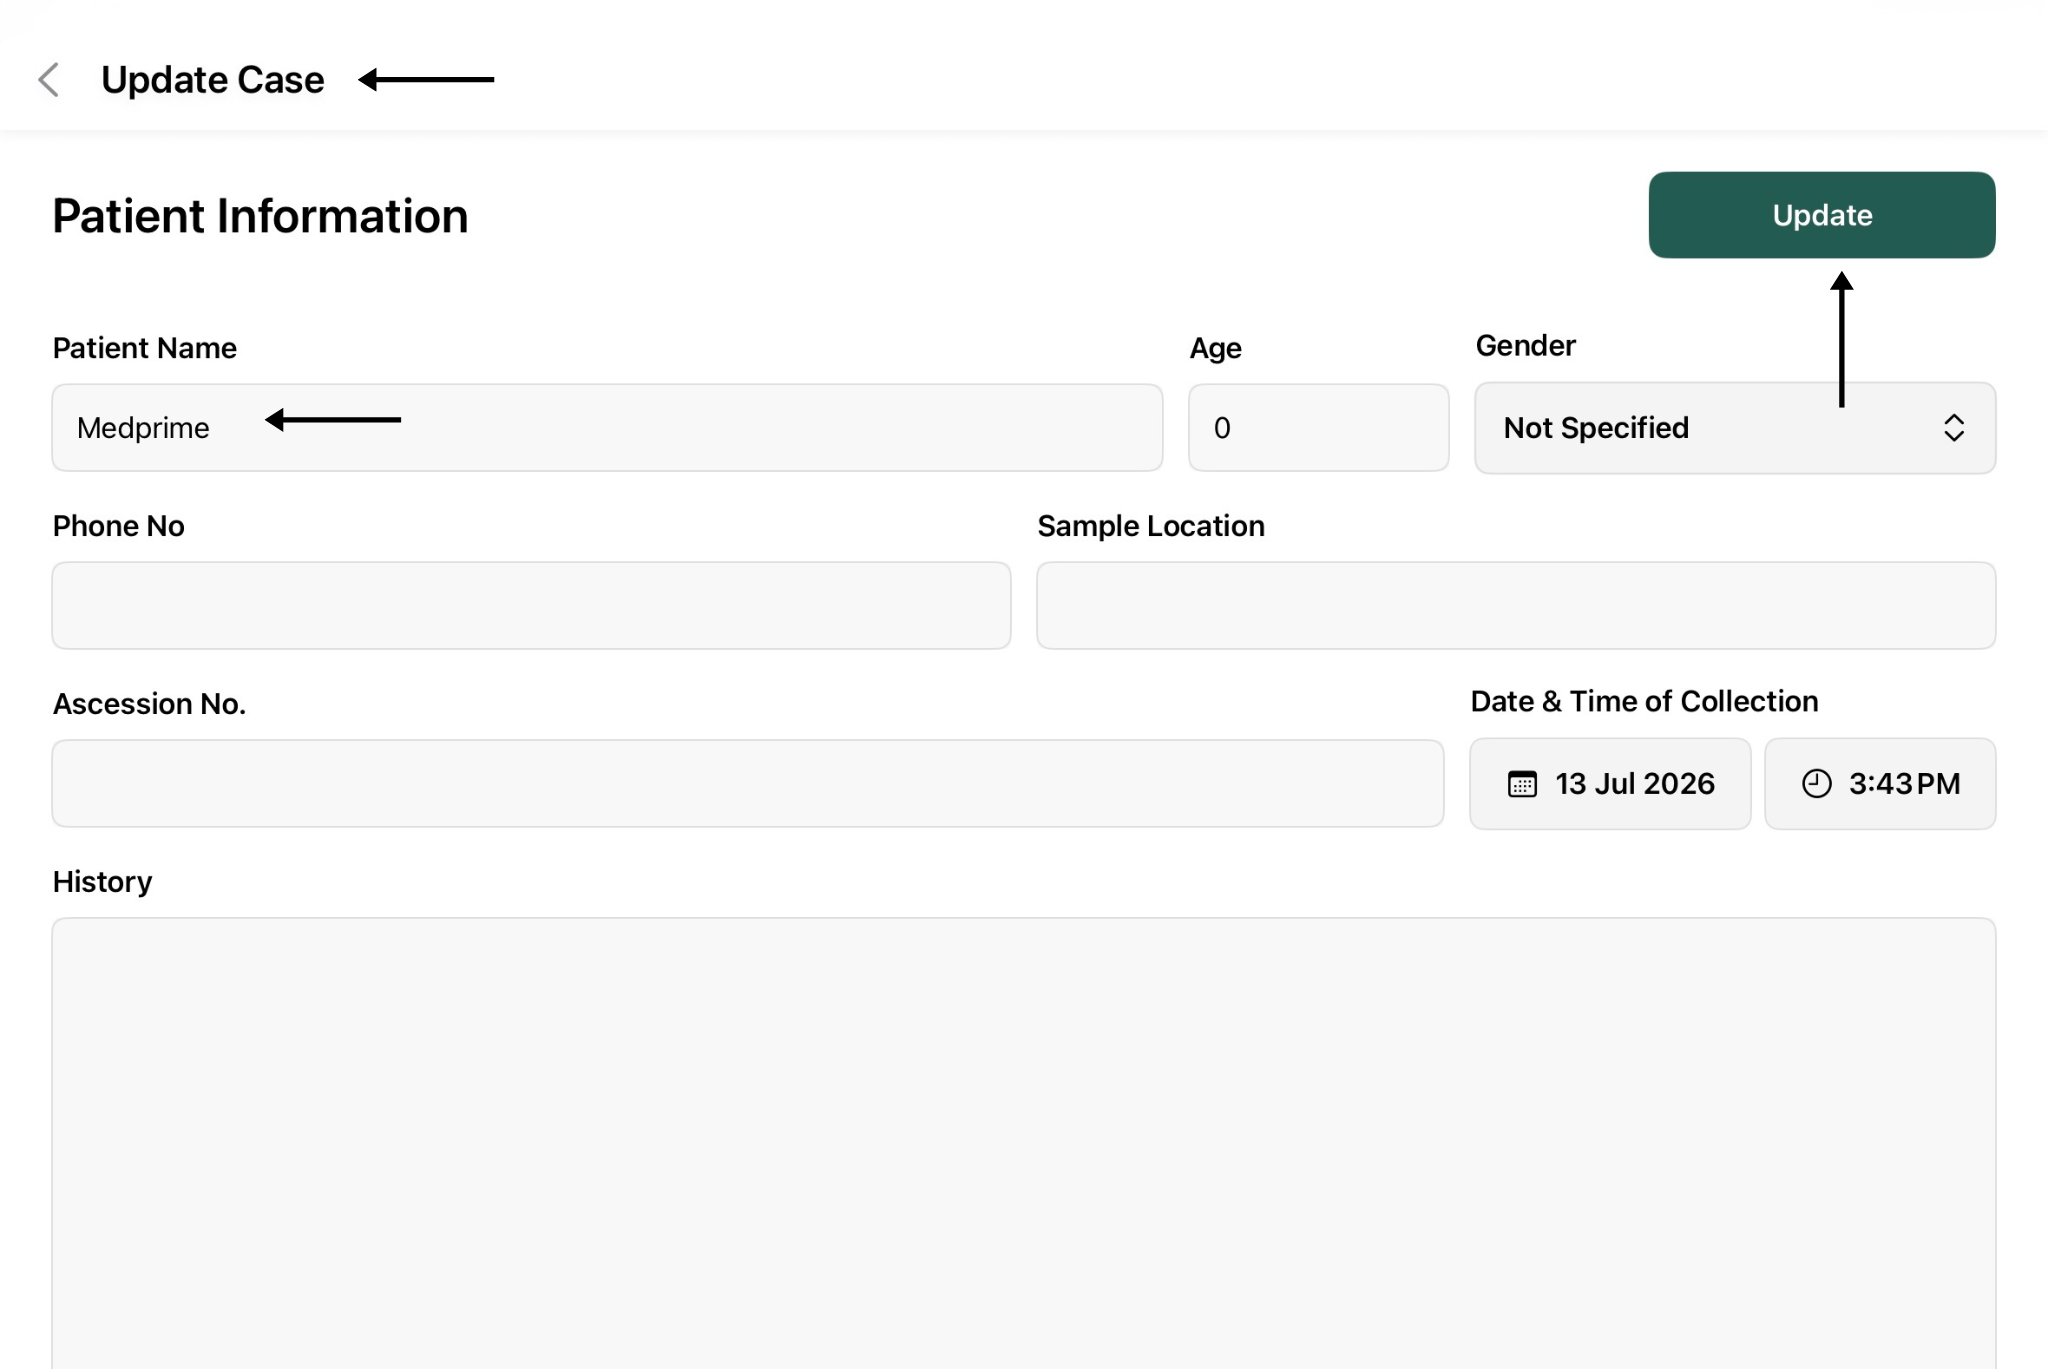 Figure 9(B).1
9(C). View Case Metrics
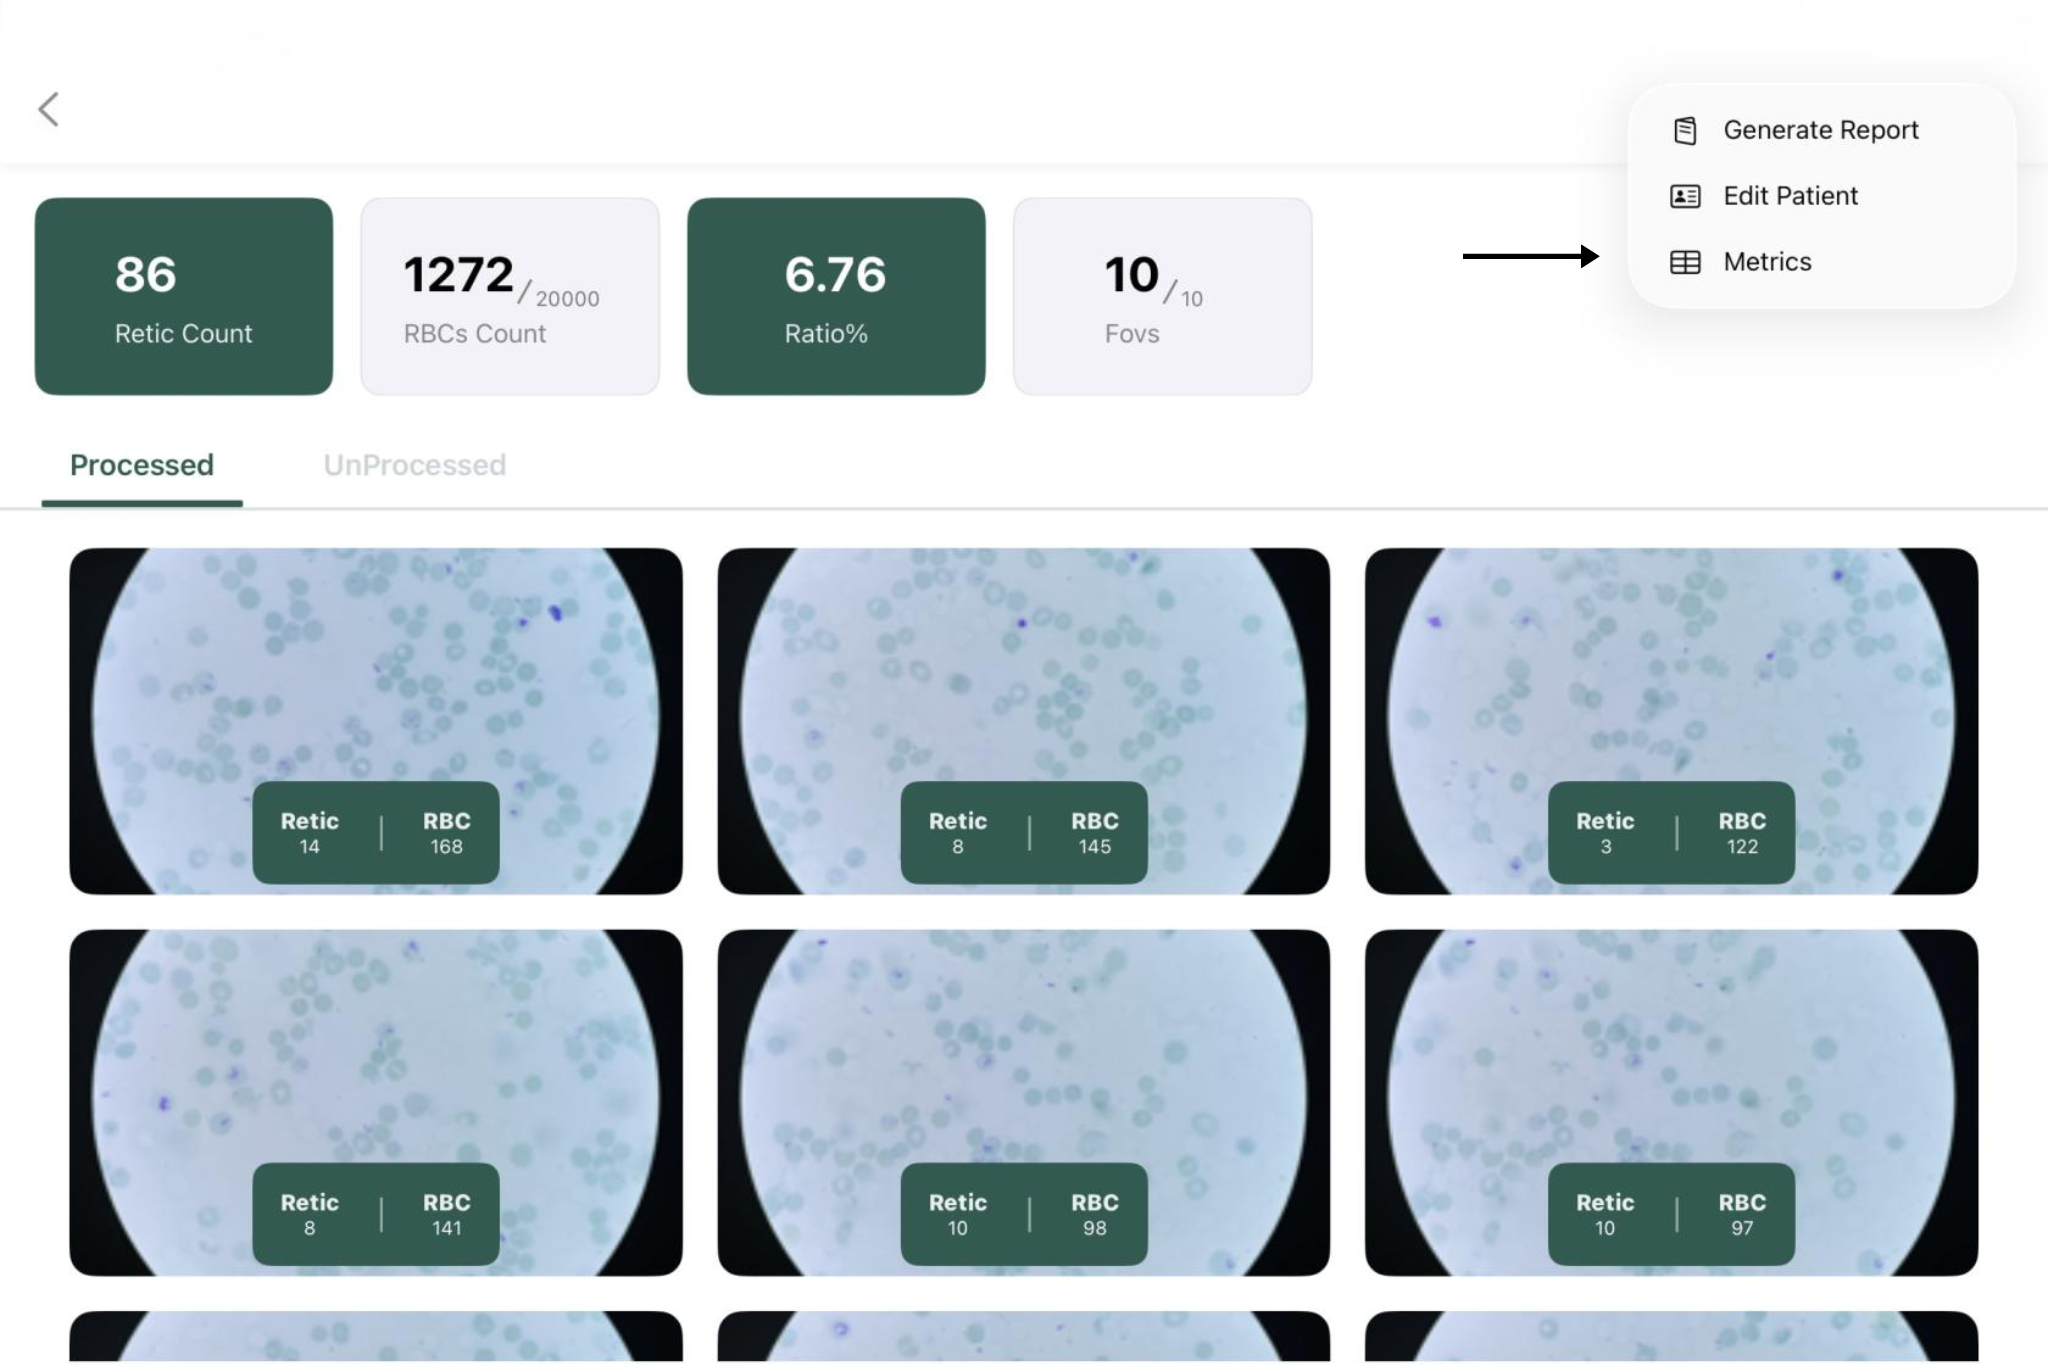
The application provides a summary of the analysis performed for the selected case.
-
Open the required case.
-
Click the More Options (⋮) menu.
-
Select Metrics.
-
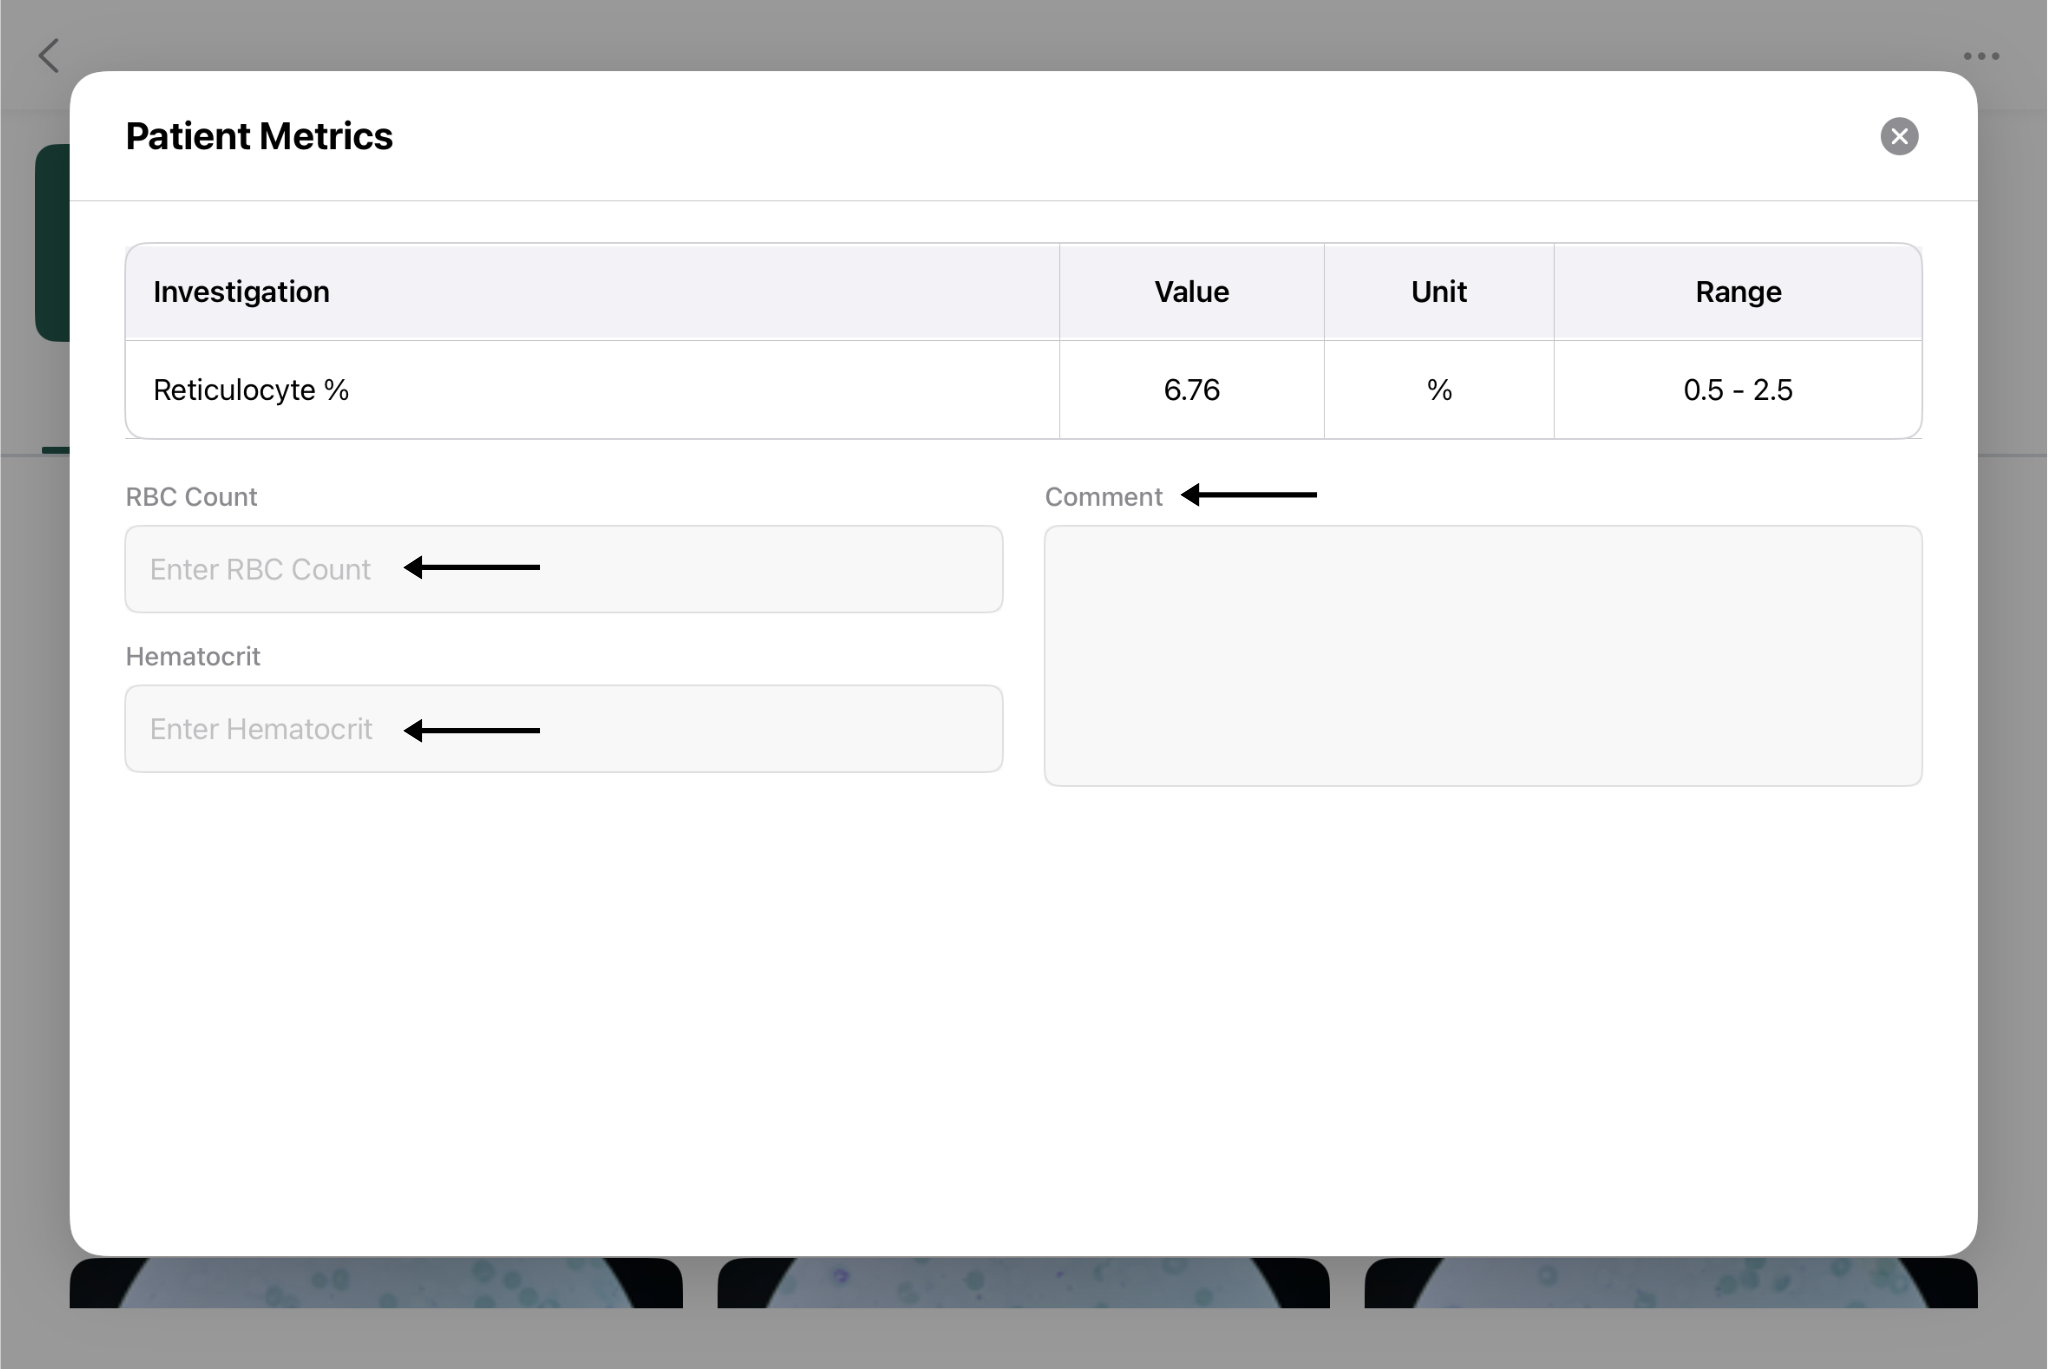
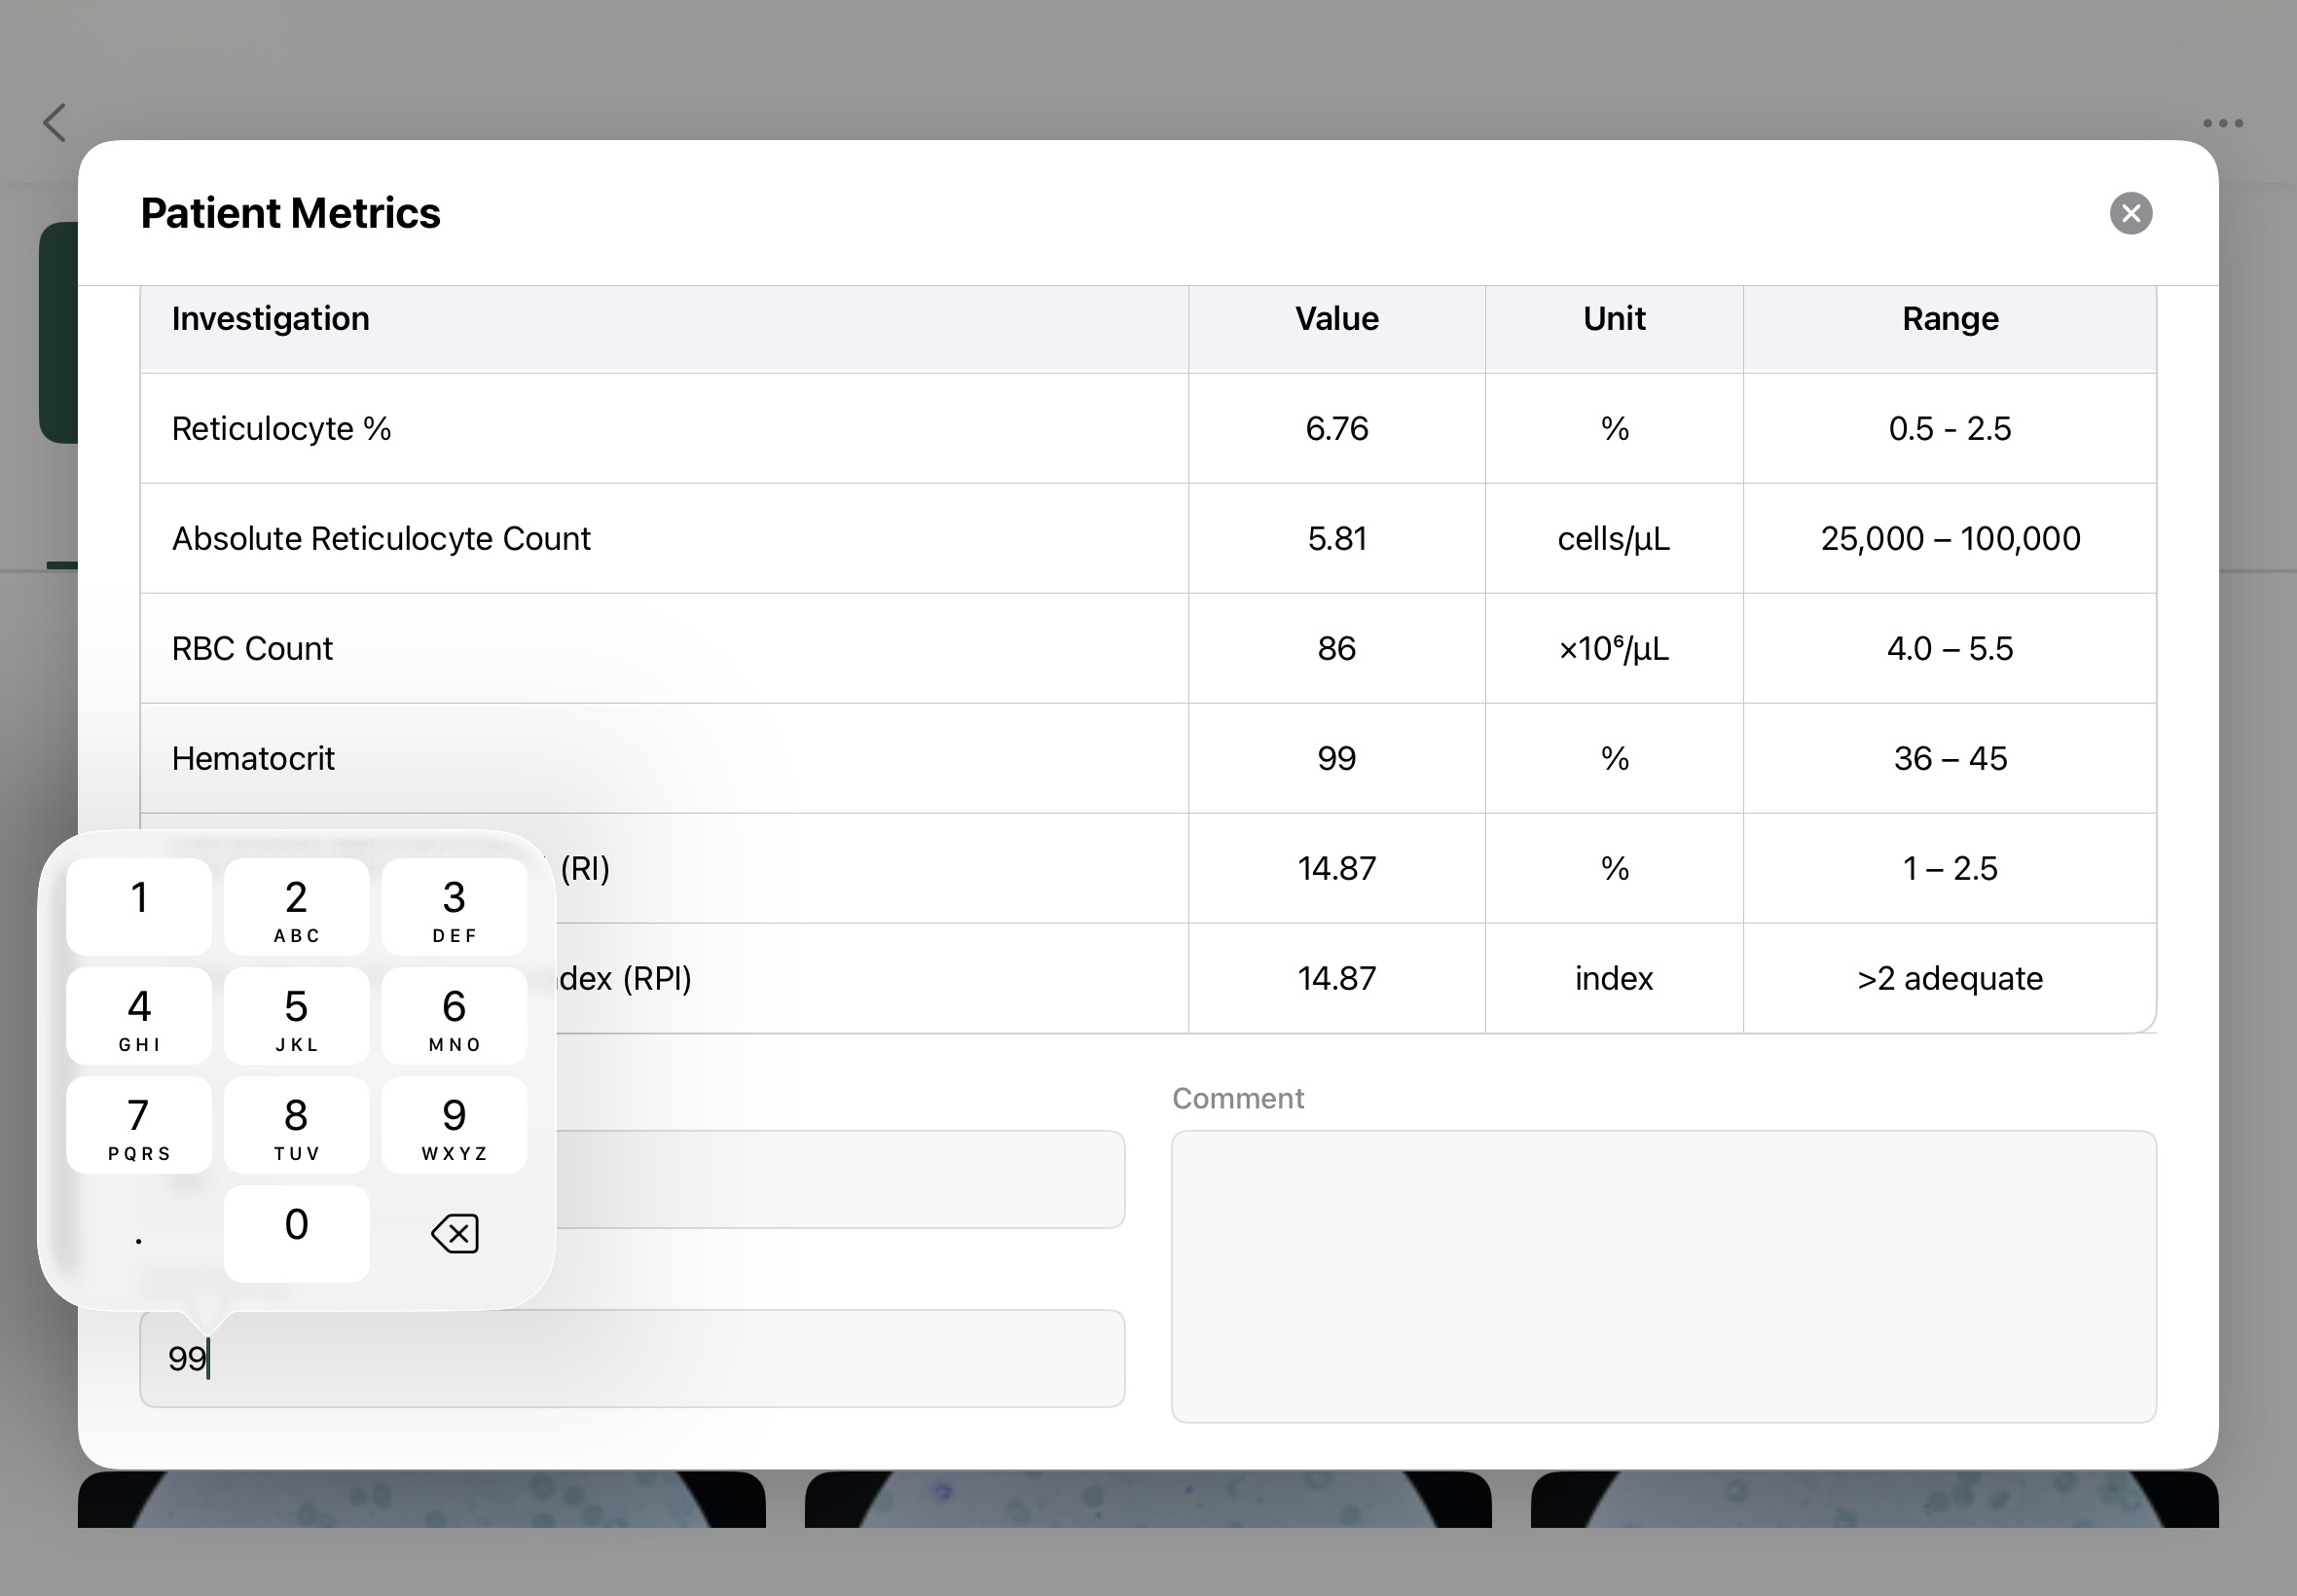
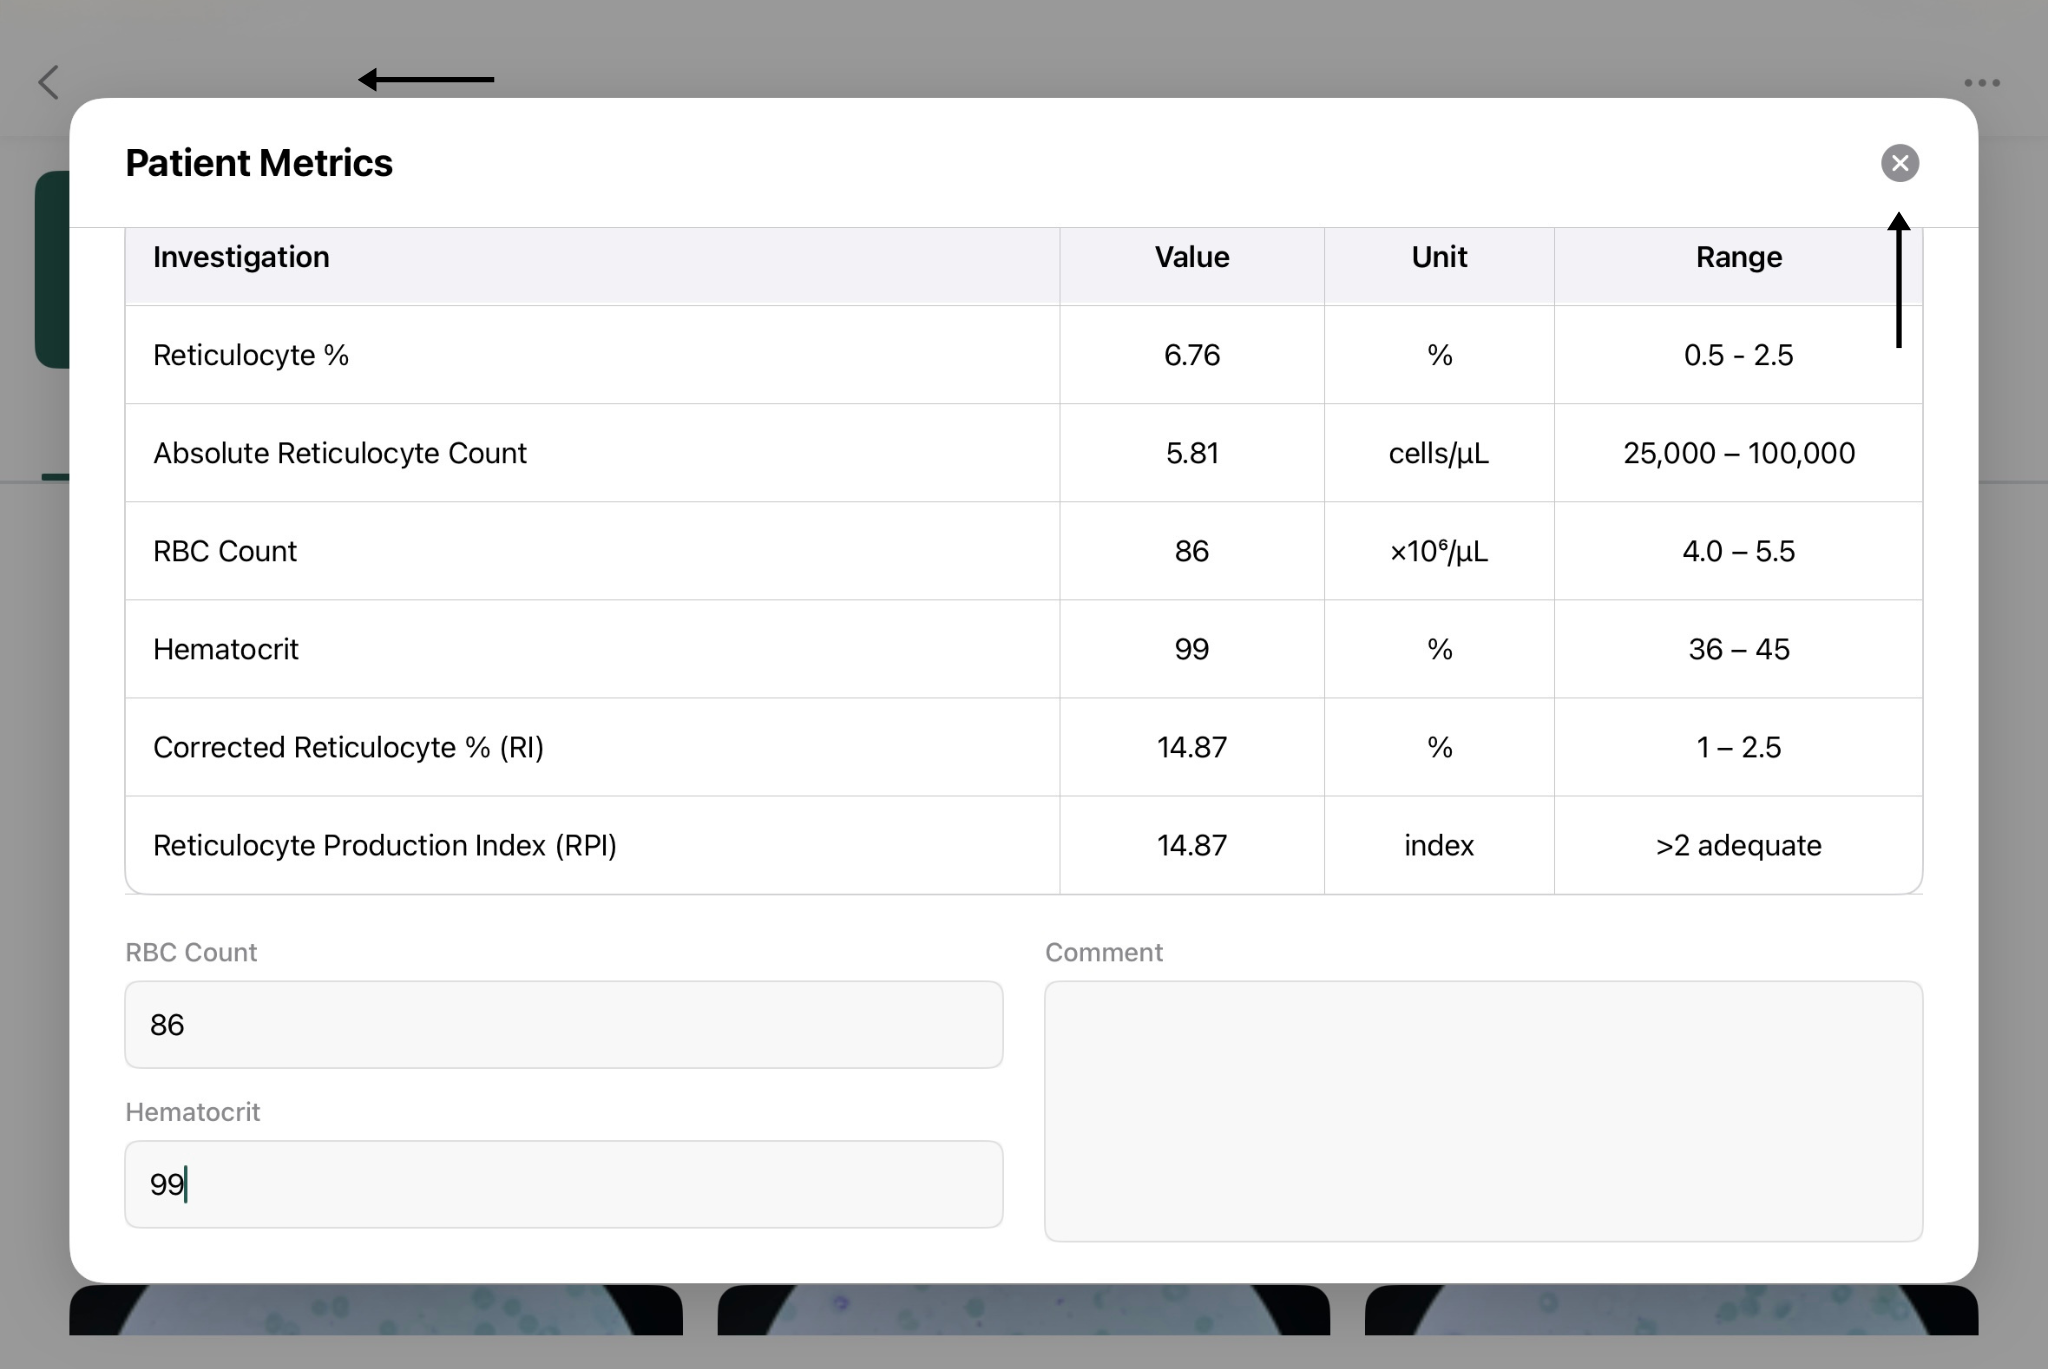
Review the displayed case metrics.
- User can add in RBC Count and Hematocrit to get a more in-depth report.
- Reopen the Patient Matrix to update changes.
|
Figure 9(C) |
|
|
Figure 9(C).2 |
Figure 9(C).3 |